The Conversion Layer
TL;DR
The Strait of Hormuz closed on February 28th. Flows through it fell from about 20 million barrels a day to an average of 2.7 across March, April and May, and cumulative Middle East supply losses passed 1.3 billion barrels. It briefly reopened in late June under a US-Iran memorandum but has been highly contested again since early July.
Prices did what you would expect, and then did something you wouldn't. In early April, North Sea Dated shot up and hit an all-time high of $144, more than double pre-war prices. Brent futures peaked near $126, but by July 2nd it was back at $69, close to where it started the year. On July 23rd it closed at $100.69 after Houthi strikes on two Saudi tankers, after briefly touching $105 intraday. In August it has traded between $85 and $93.
Meanwhile, Henry Hub is at ~$2.60.
A round trip from $144 to $69 and back to $105 inside four months is not a market pricing sustained physical scarcity. It's a market pricing political risk on top of a supply system that turned out to have more give in it than anyone suspected.
But give isn't the same as resilience, and the distinction matters enough to show the math before going any deeper.
Over the same five months, transformer lead times went to four years, GE Vernova's turbine book reached 116 GW, and Lawrence Berkeley published the finding that only 13% of all generating capacity ever entered into a US interconnection queue has actually reached commercial operation.
In December I wrote about the coming collision between AI's appetite and America's energy reality, and argued that the United States was heading toward a choice it had not priced. In March, after Hormuz began closing, I wrote that the era of "or" had arrived four years early. Both pieces were about the physical constraints and impending price collision. This one asks the question that comes after it: given what is physically available, where does capital earn a return?
Most of the writing on this treats energy as one market. It's actually two. Fuel scarcity and power scarcity are different problems, they price on different clocks, and only one of them is currently binding.
| Layer | Constraint | Binds through | Where the return sits |
|---|---|---|---|
| Fuel in the ground | None. Coal R/P 139 yrs world, 514 US; gas 49; oil 53 | n/a | Not here. Reserves are abundant and price-elastic |
| Fuel logistics | Regional. Europe short 278 Bcm/yr; Asia Pacific 259 Bcm | Structural | LNG chain, the $2.60 vs $21 spread |
| Generation equipment | ~220 GW big-three backlog vs ~52–60 GW/yr output, but only ~46% firm | 2029 | OEM backlog; check the firm-vs-reservation split |
| Electrical balance of plant | Transformer lead times 4 yrs; step-up transformer waits tripled | 2029 | Transformers, HV cable, grain-oriented steel |
| Grid connection | 13% queue completion; median 5+ yrs from request to power | 2032 | Already-interconnected assets; behind-the-meter |
| Nuclear fuel cycle | Enrichment and conversion tighter than mining | 2030+ | Enrichment capacity, conversion, advanced fuel |
| Materials | Announced copper mine supply falls to 17.2 Mt by 2040 vs ~35 Mt demand | 2030+ | Copper, with the price-elasticity caveat |
| Compute | Memory. AI chip output reaches ~25 GW/yr of servers only by 2030 | end-2027 | Upstream of everything; caps the whole ask |
Fuel markets clear in weeks. The machines that convert fuel into electrons clear in years. The rent is accruing to the machines.
US data centers reach roughly 615 TWh in 2030, 11 to 12% of American electricity against 6.55% today (confidence band of ~510 to ~740). Last year wasn't a spike, it was the run-rate. US generation grew 133 TWh in 2025 and data centers took 64 TWh of it, and the base case keeps that ratio roughly intact, 46% of every new TWh out to 2030. Section I shows how this maps out.
How to read this
This is a long piece, and deliberately so: the argument needs a demand side, a fuel side, a generation side, a constraint stack, and a portfolio, and removing any one of them removes an important component. If you're short of time, this table tells most of the story:
| The question | The number to take away | |
|---|---|---|
| I | How big is the data center growth story? | ~615 TWh by 2030, bands ~510–740 |
| II | Is there enough fuel? | Yes, by orders of magnitude. But the buffers that absorbed 2026 are spent |
| III | What can each source actually deliver? | World solar runs at 15% of nameplate, unchanged in six years |
| IV | So what binds, and when? | Memory to 2027, turbines to 2029, the queue to 2032 |
| V | Where does the constraint become a return? | Inframarginal rent, and a signed lease at $270/MWh |
| VI | Where can a gigawatt actually land? | Six months behind the meter, five to ten years through the queue |
| VII | What would make all of this wrong? | Efficiency, phantom demand, and a workload nobody has disclosed |
| VIII | What am I watching? | The turbine reservation-conversion ratio, quarterly |
I. The size of the ask
The answer first, then the workings. I derived that 615 TWh three independent ways, sharing almost no inputs between them:
| Route | Central estimate | Share of US electricity |
|---|---|---|
| Extrapolate the 2020–25 trend | 566–629 TWh | 10.4–11.6% |
| Janus Henderson's bottom-up project ledger | 618–721 TWh | 11.4–13.3% |
| Published forecasts (IEA, BNEF, EPRI) | 506–652 TWh | 9.3–12.0% |
| Median of the three | 598 TWh | 11.0% |
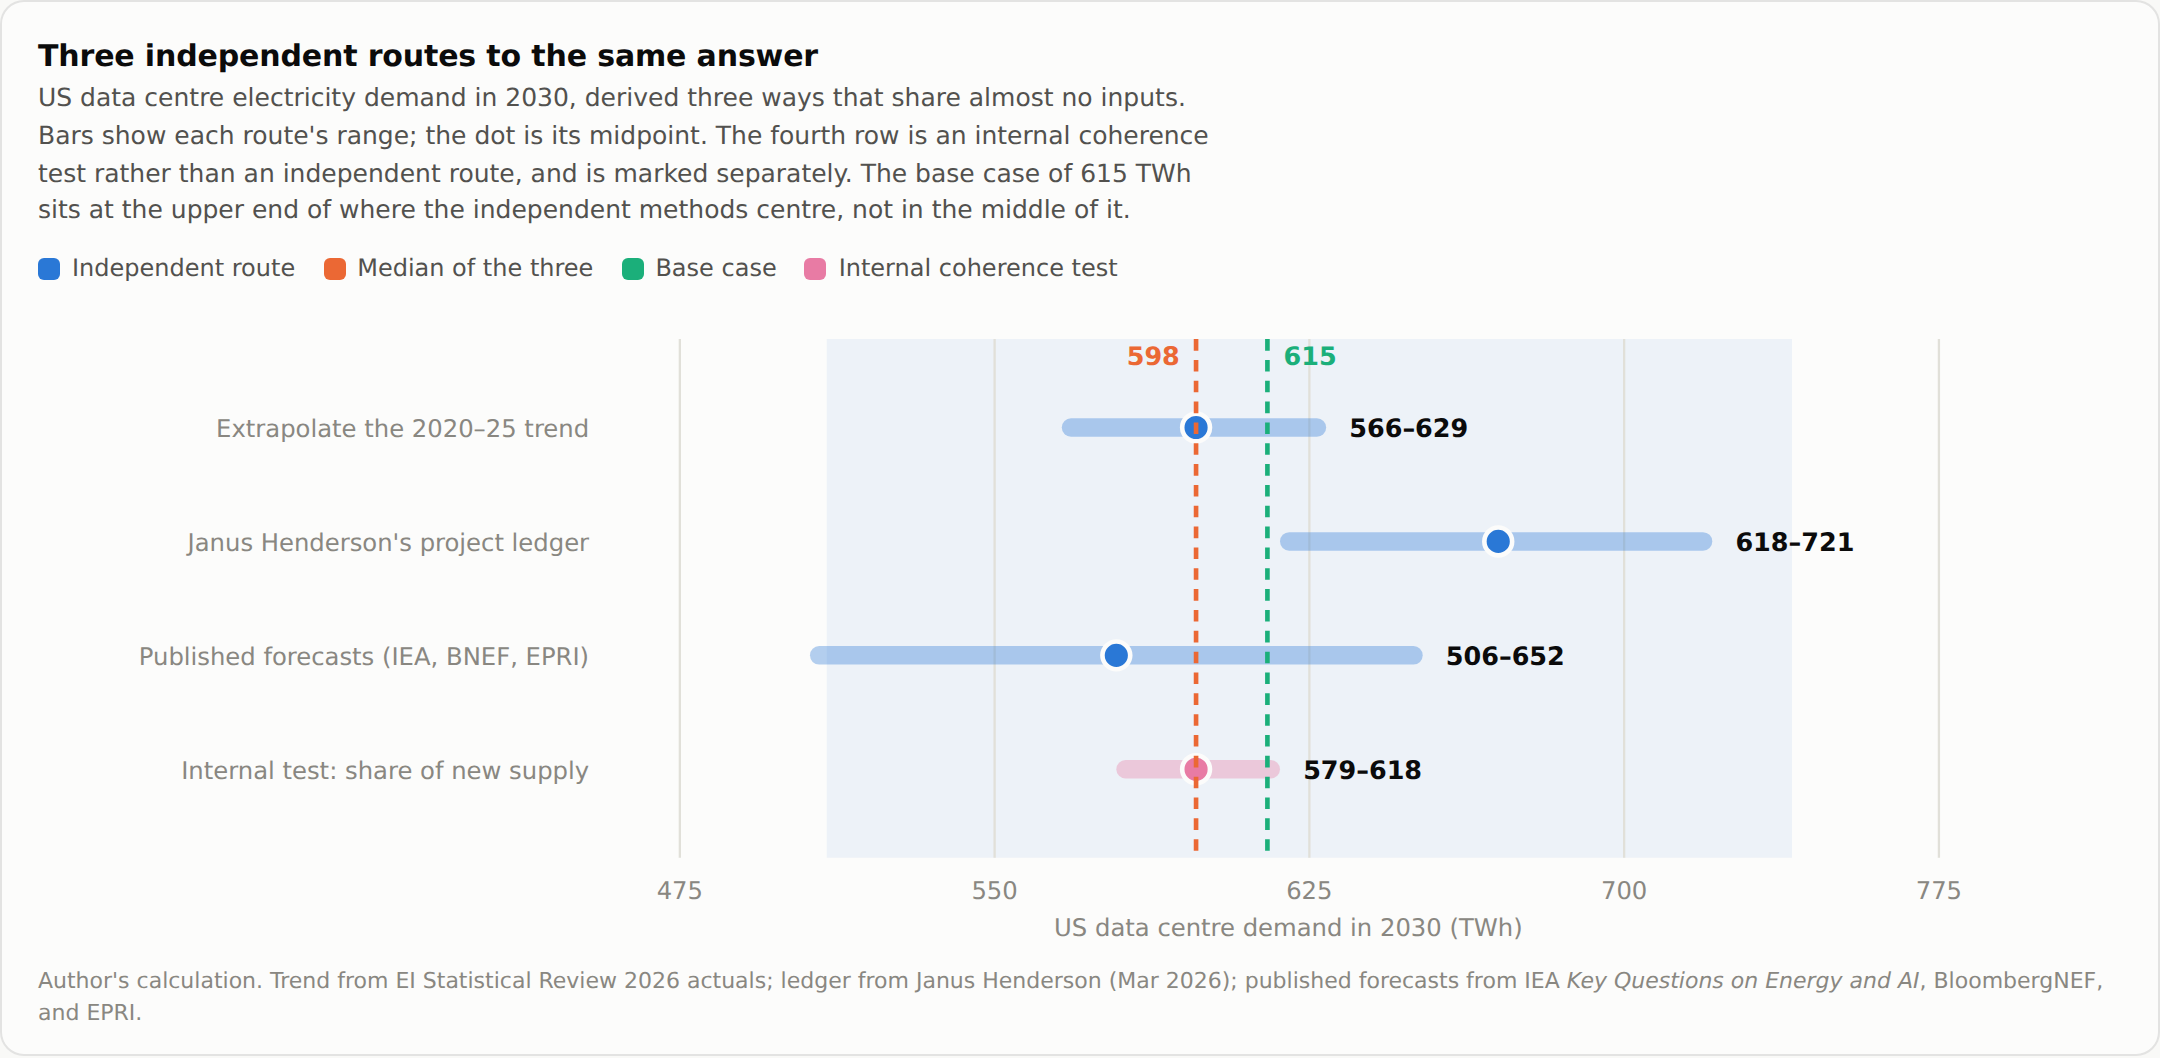
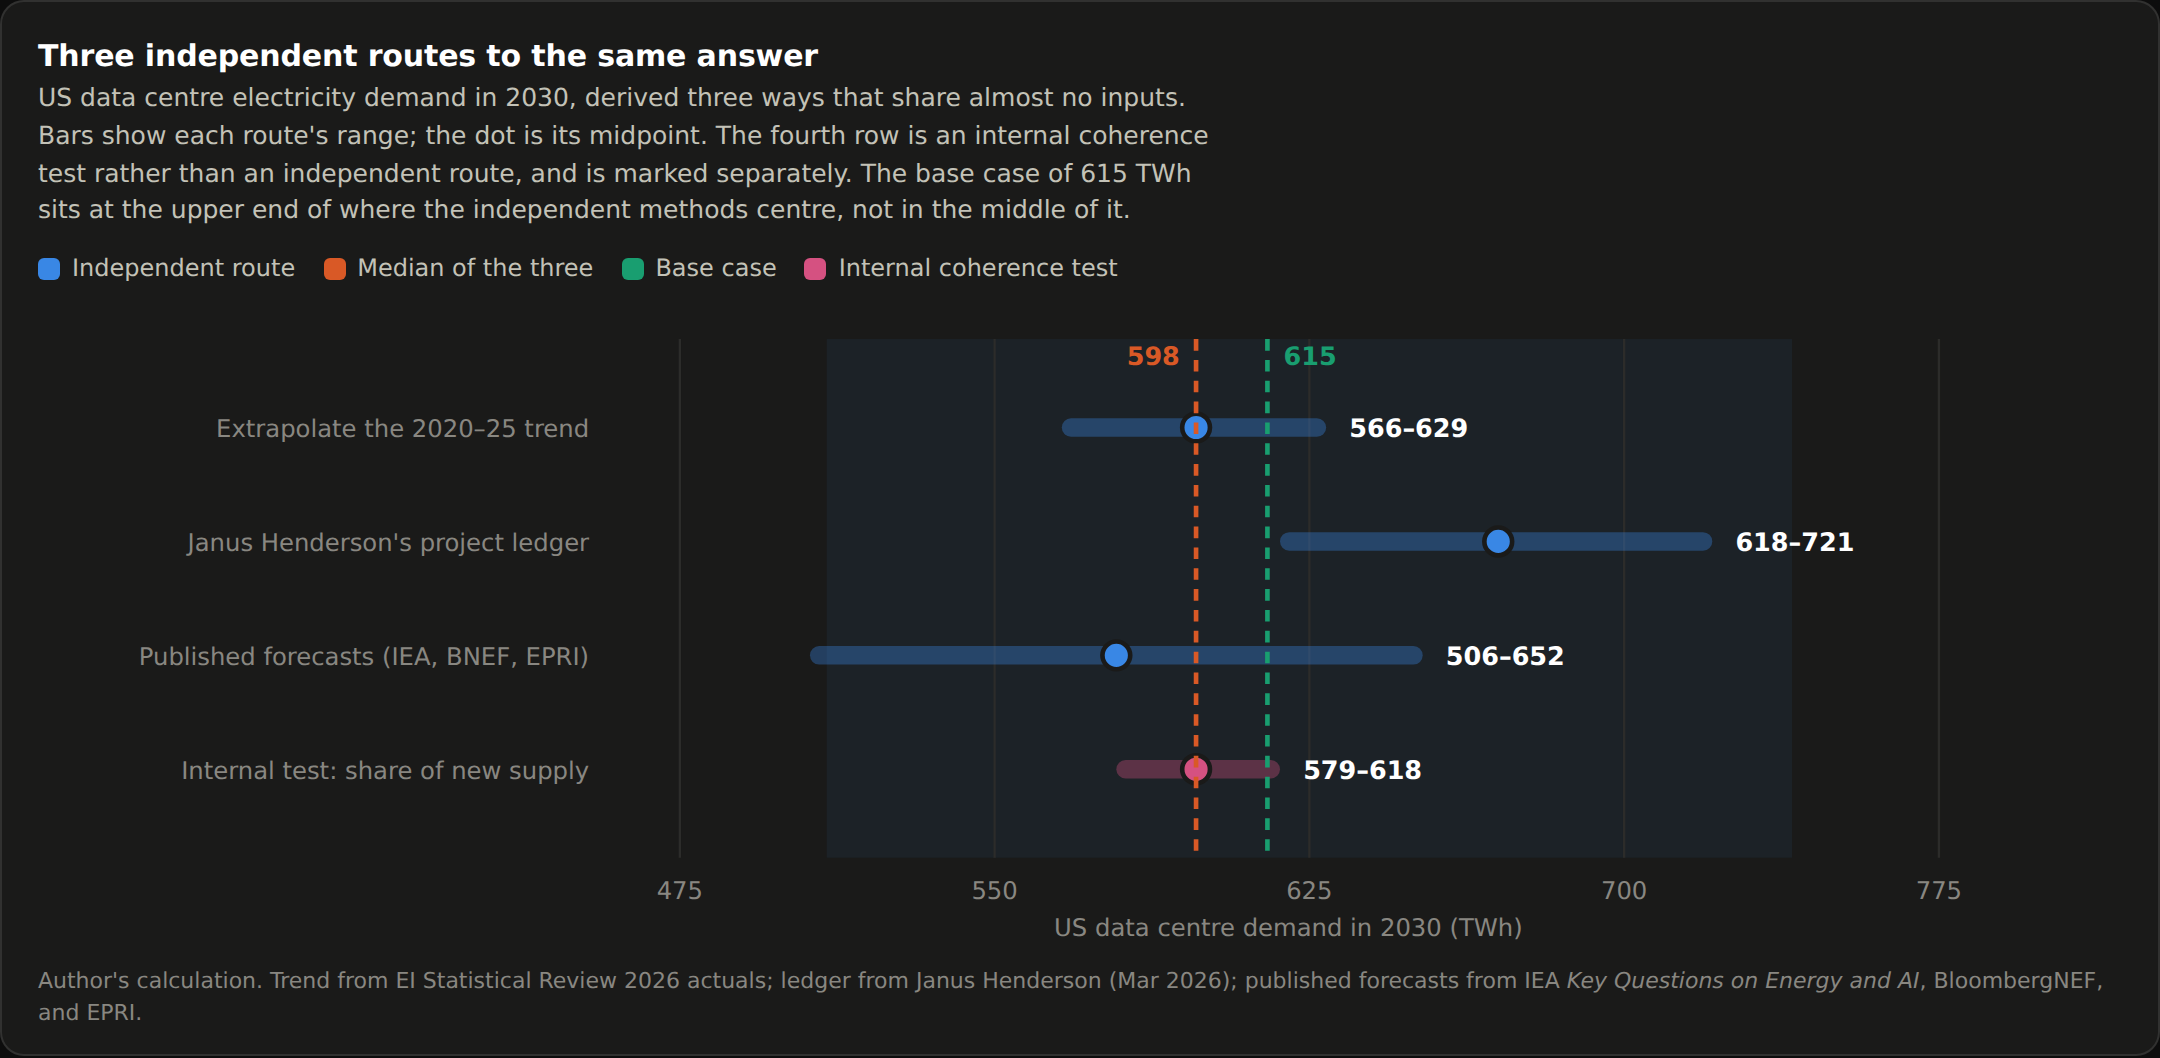
The band around it is 510 to 740, and Section I's closing subsection shows why that width does not damage the argument. A single number derived one way is a guess. The same number arrived at three ways is worth arguing with.
Five things have to be settled before the table means anything, and each one moves the answer by more than the entire published scenario spread.
The definitional gap
Two credible figures for 2025 global data center electricity, 62% apart:
- 485 TWh, 1.5% of world generation (IEA, April 2026), of which roughly 155 TWh is AI-focused.
- 788 TWh, 2.45% (Energy Institute 2026, on S&P Global capacity-based data).
Most of the gap is bitcoin. Cryptocurrency mining runs somewhere near 150 to 200 TWh and the EI series carries it while the IEA's does not. The rest is method: S&P models bottom-up from installed capacity with utilization assumptions, the IEA estimates IT, cooling, and infrastructure load directly, and neither publishes enough to reconcile fully. Hannah Ritchie's treatment at Our World in Data is the fairest reconciliation of what is and is not comparable.
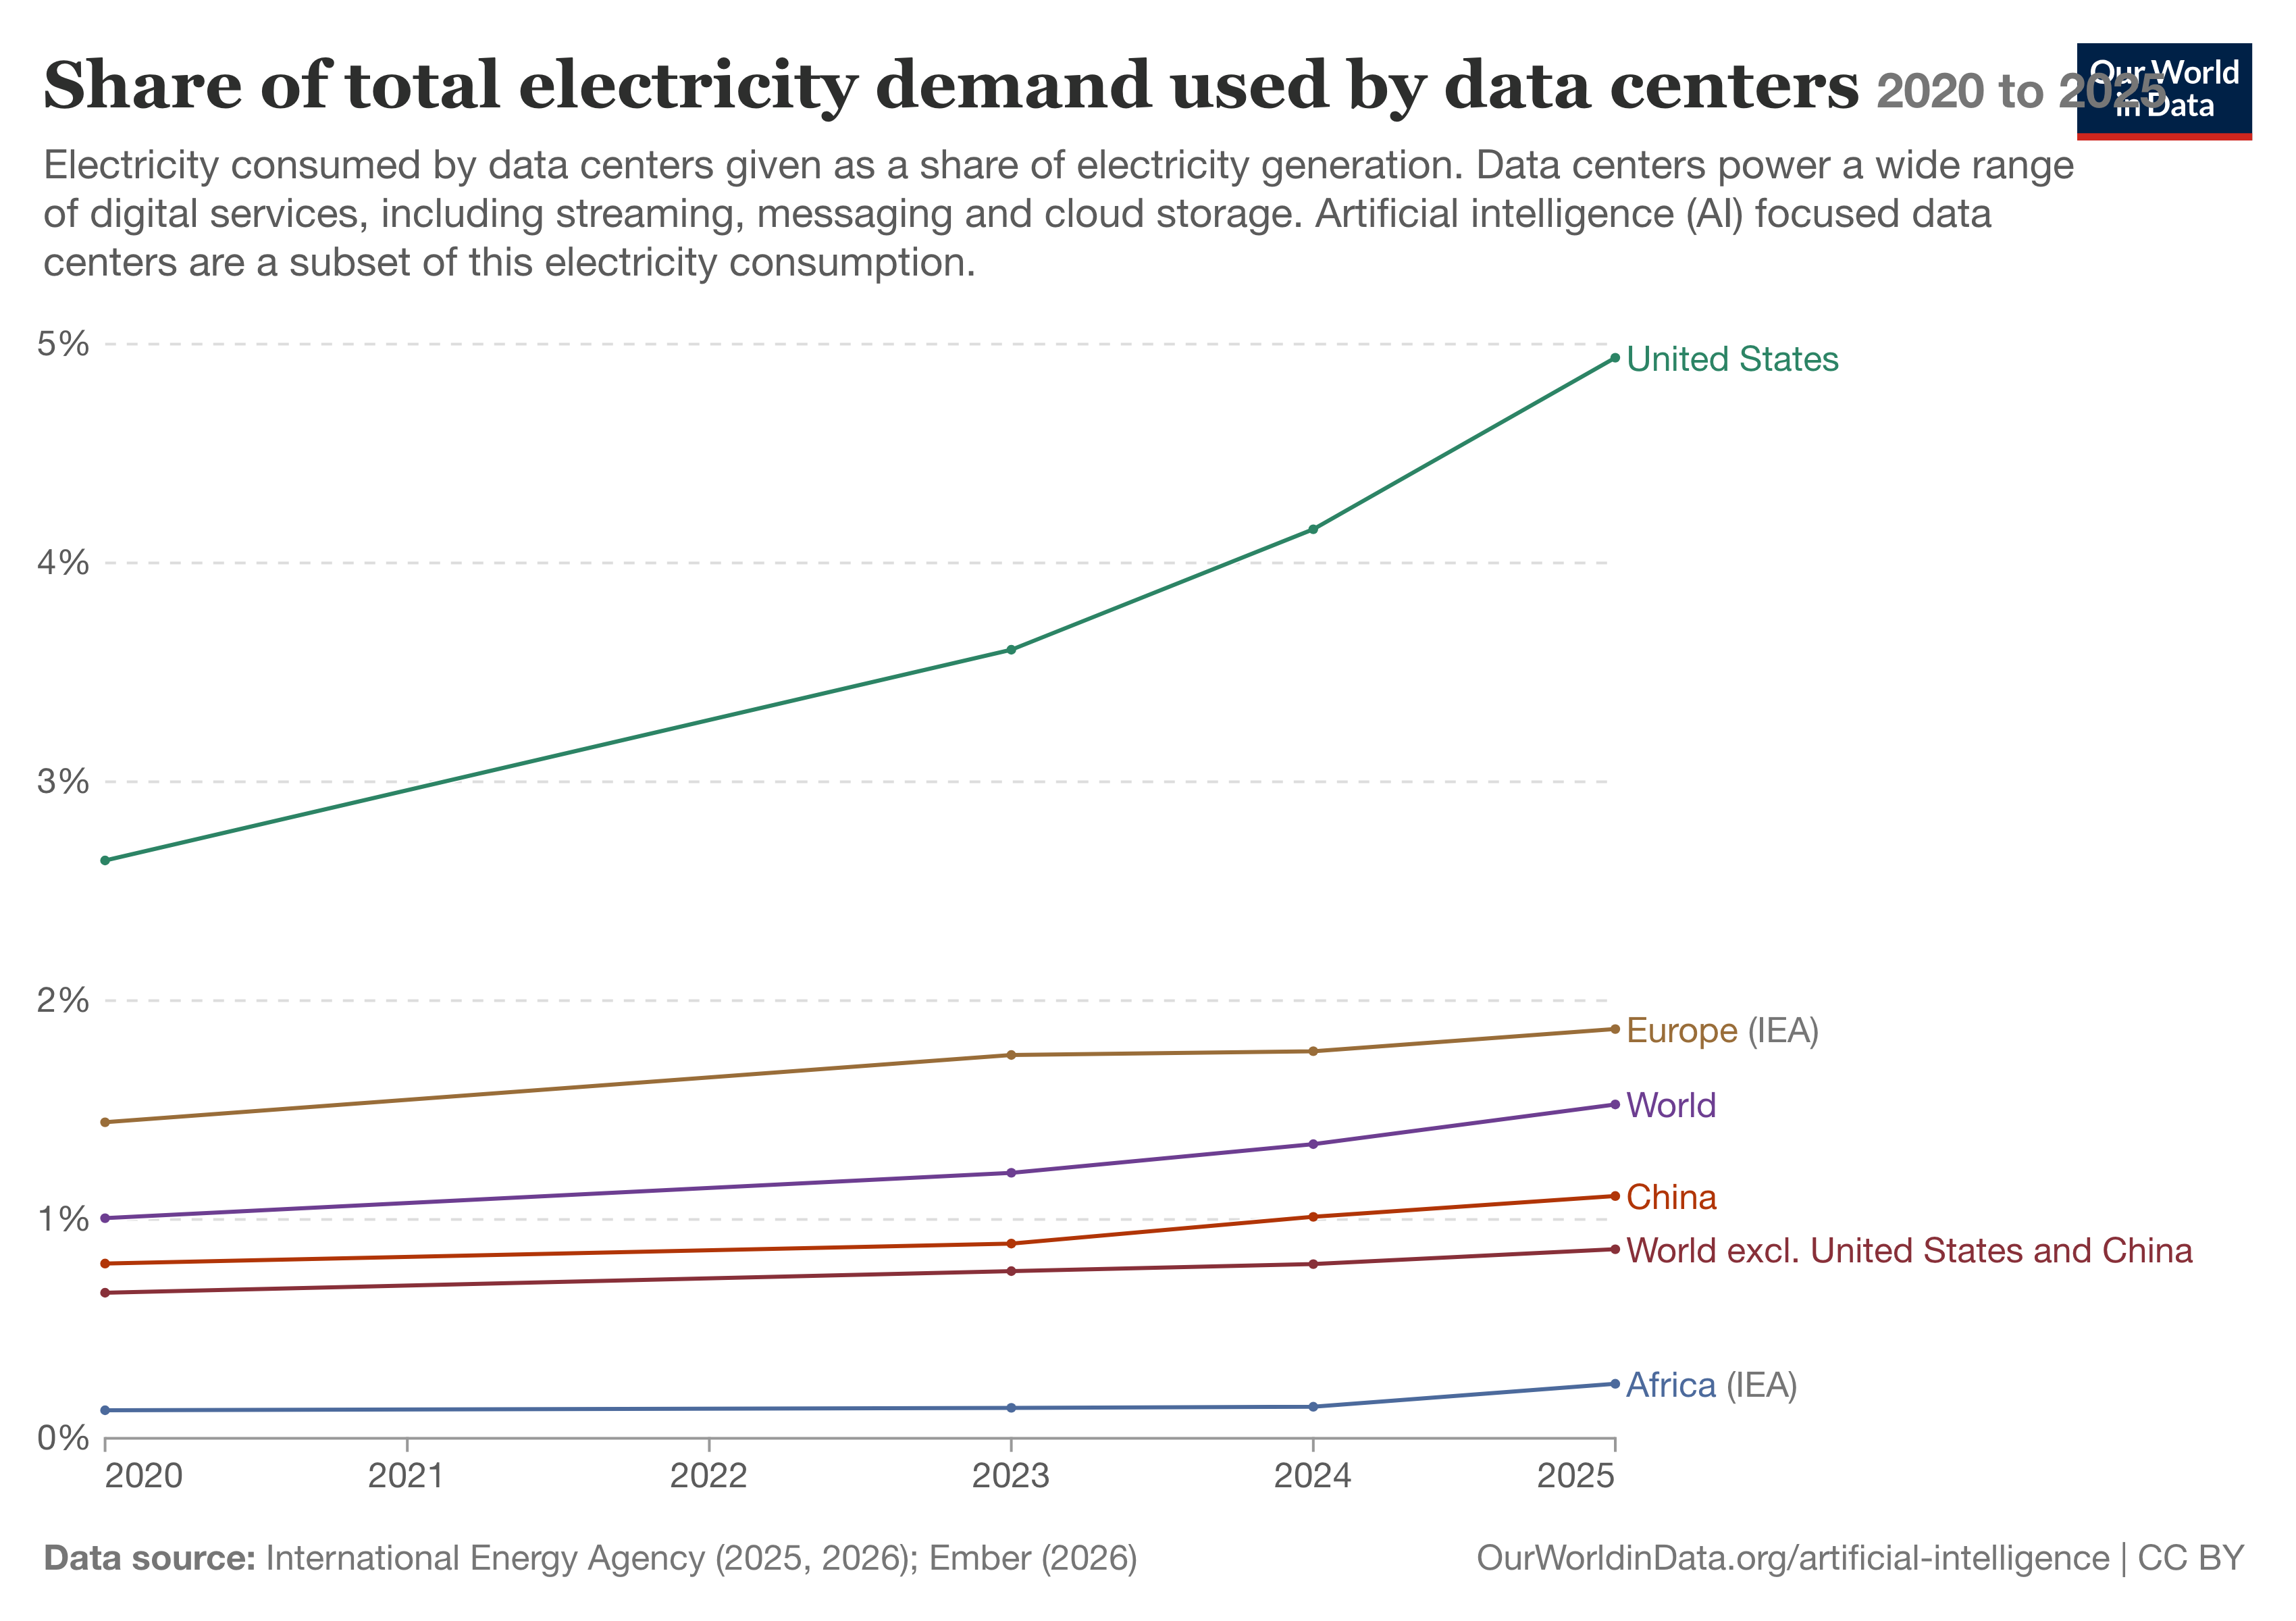
The EI series is the more useful one for investment purposes, because it captures the load that is actually on the wire competing for interconnection, whatever it happens to compute.
| 2020 | 2023 | 2024 | 2025 | |
|---|---|---|---|---|
| World data center demand (TWh) | 411 | 578 | 658 | 788 |
| United States | 173 | 232 | 249 | 313 |
| China | 87 | 132 | 171 | 206 |
| World, % of generation | 1.52% | 1.92% | 2.10% | 2.45% |
| US, % of generation | 4.03% | 5.17% | 5.37% | 6.55% |
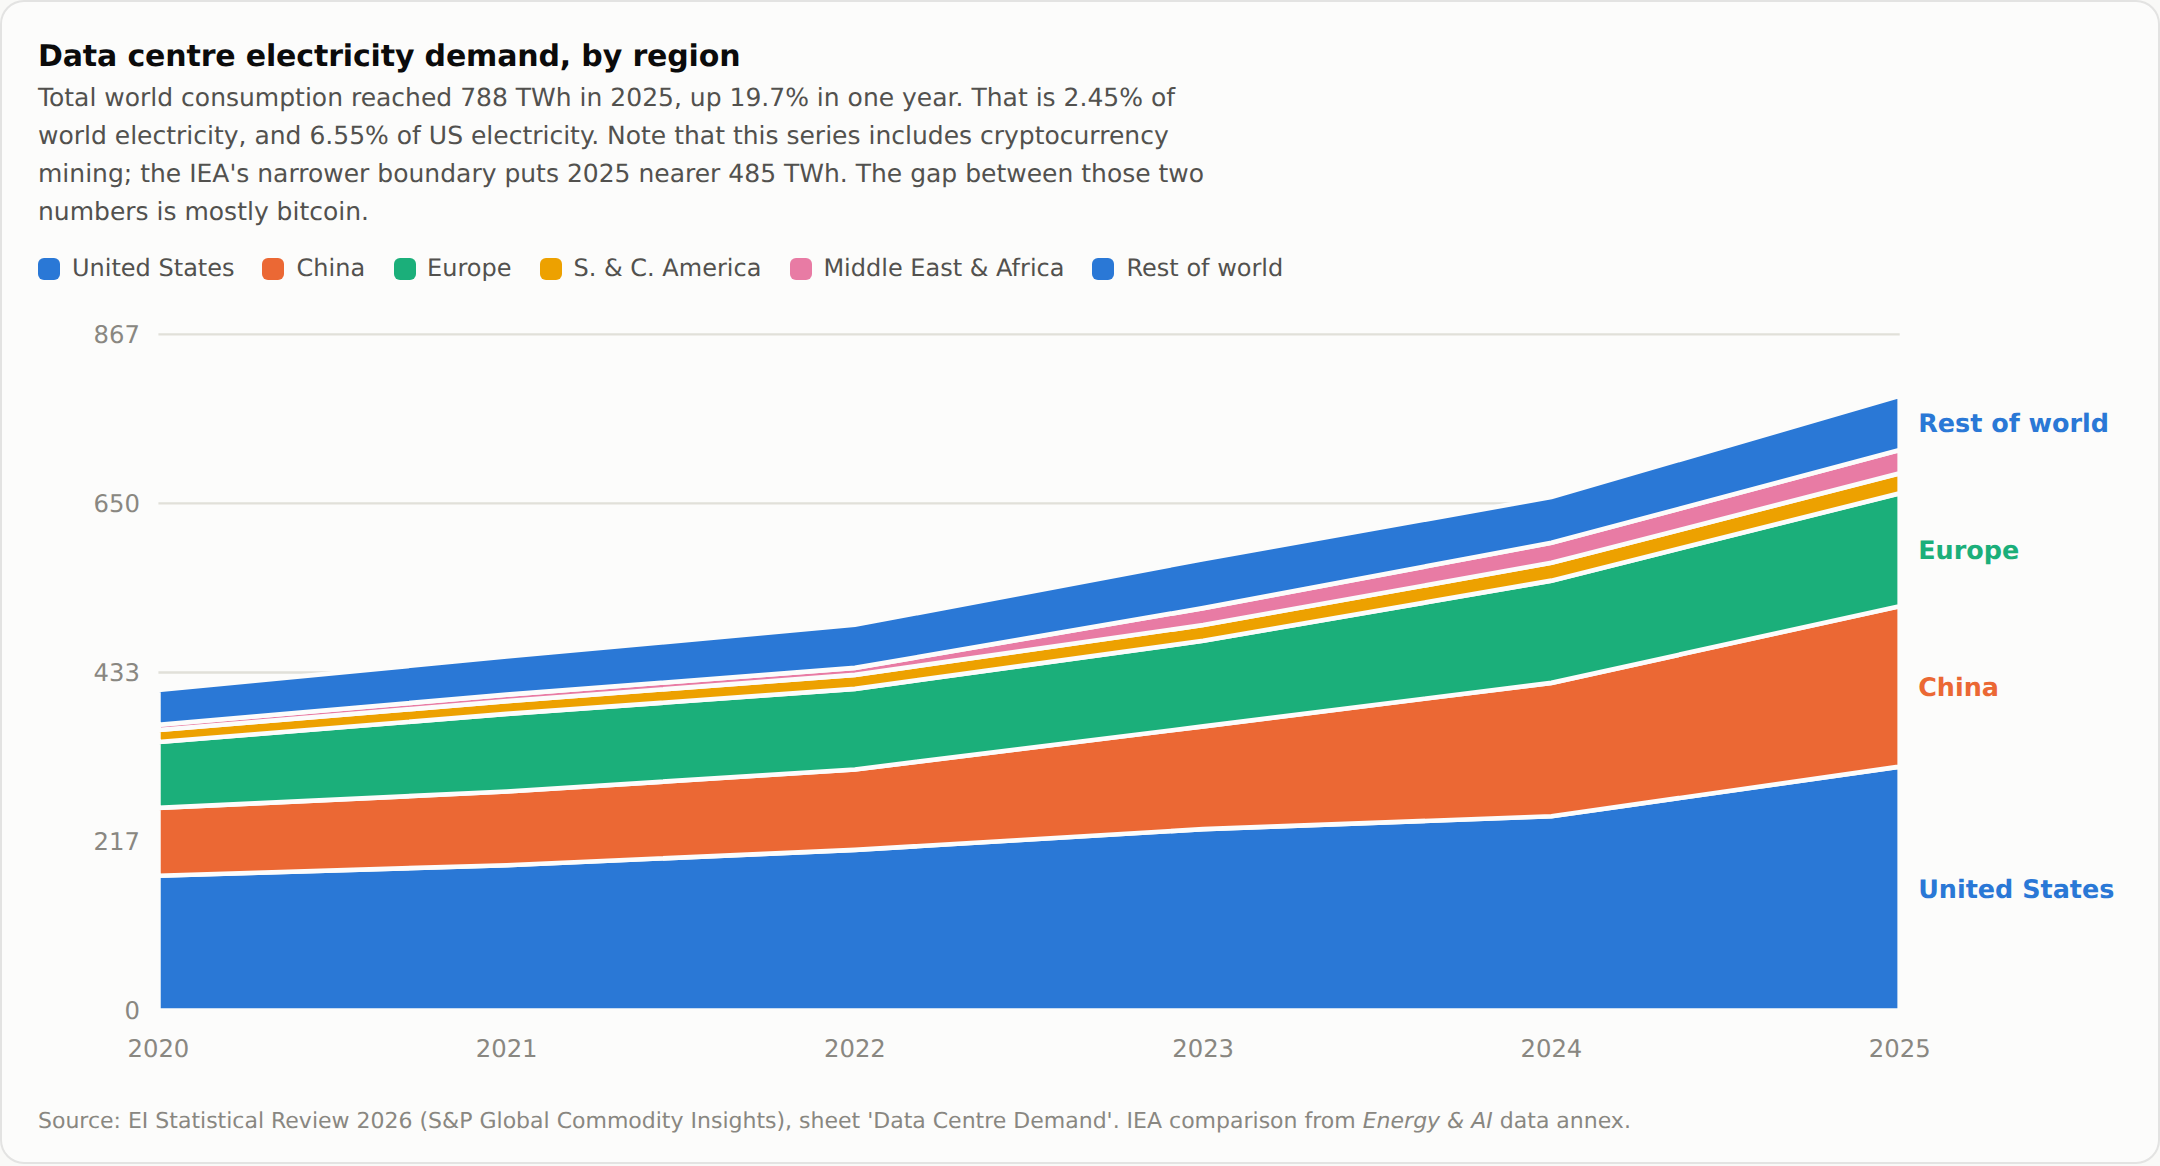
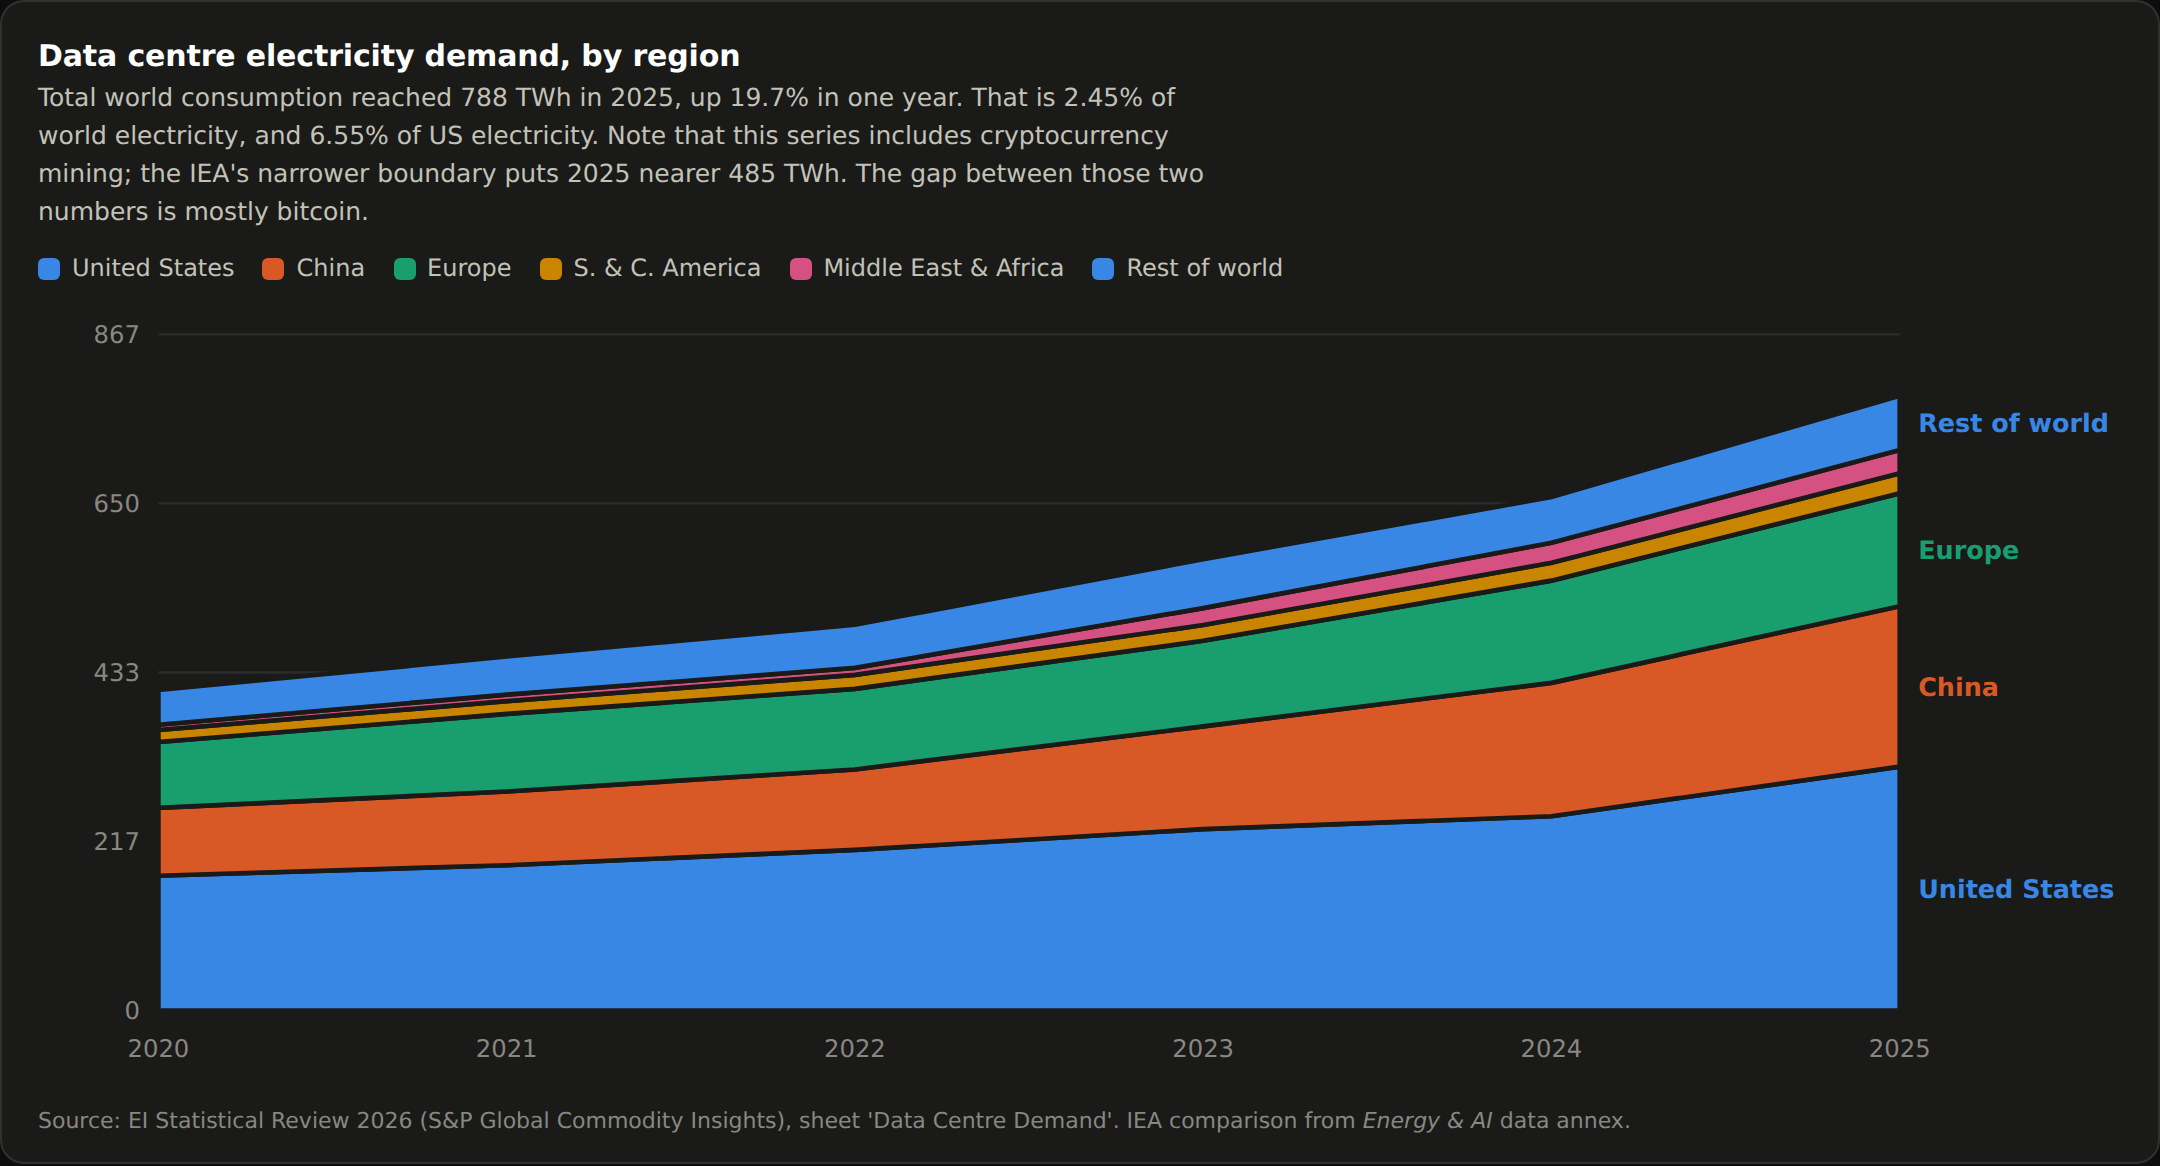
788 TWh is 90 GW of average continuous load worldwide, 36 GW of it American. The growth is concentrating hard at the margin:
| Share of incremental generation taken by data centers | 2022 | 2023 | 2024 | 2025 |
|---|---|---|---|---|
| World | 6.2% | 10.6% | 6.1% | 15.2% |
| United States | 14.4% | n/a | 11.8% | 47.7% |
| China | 2.7% | 4.7% | 6.2% | 7.1% |
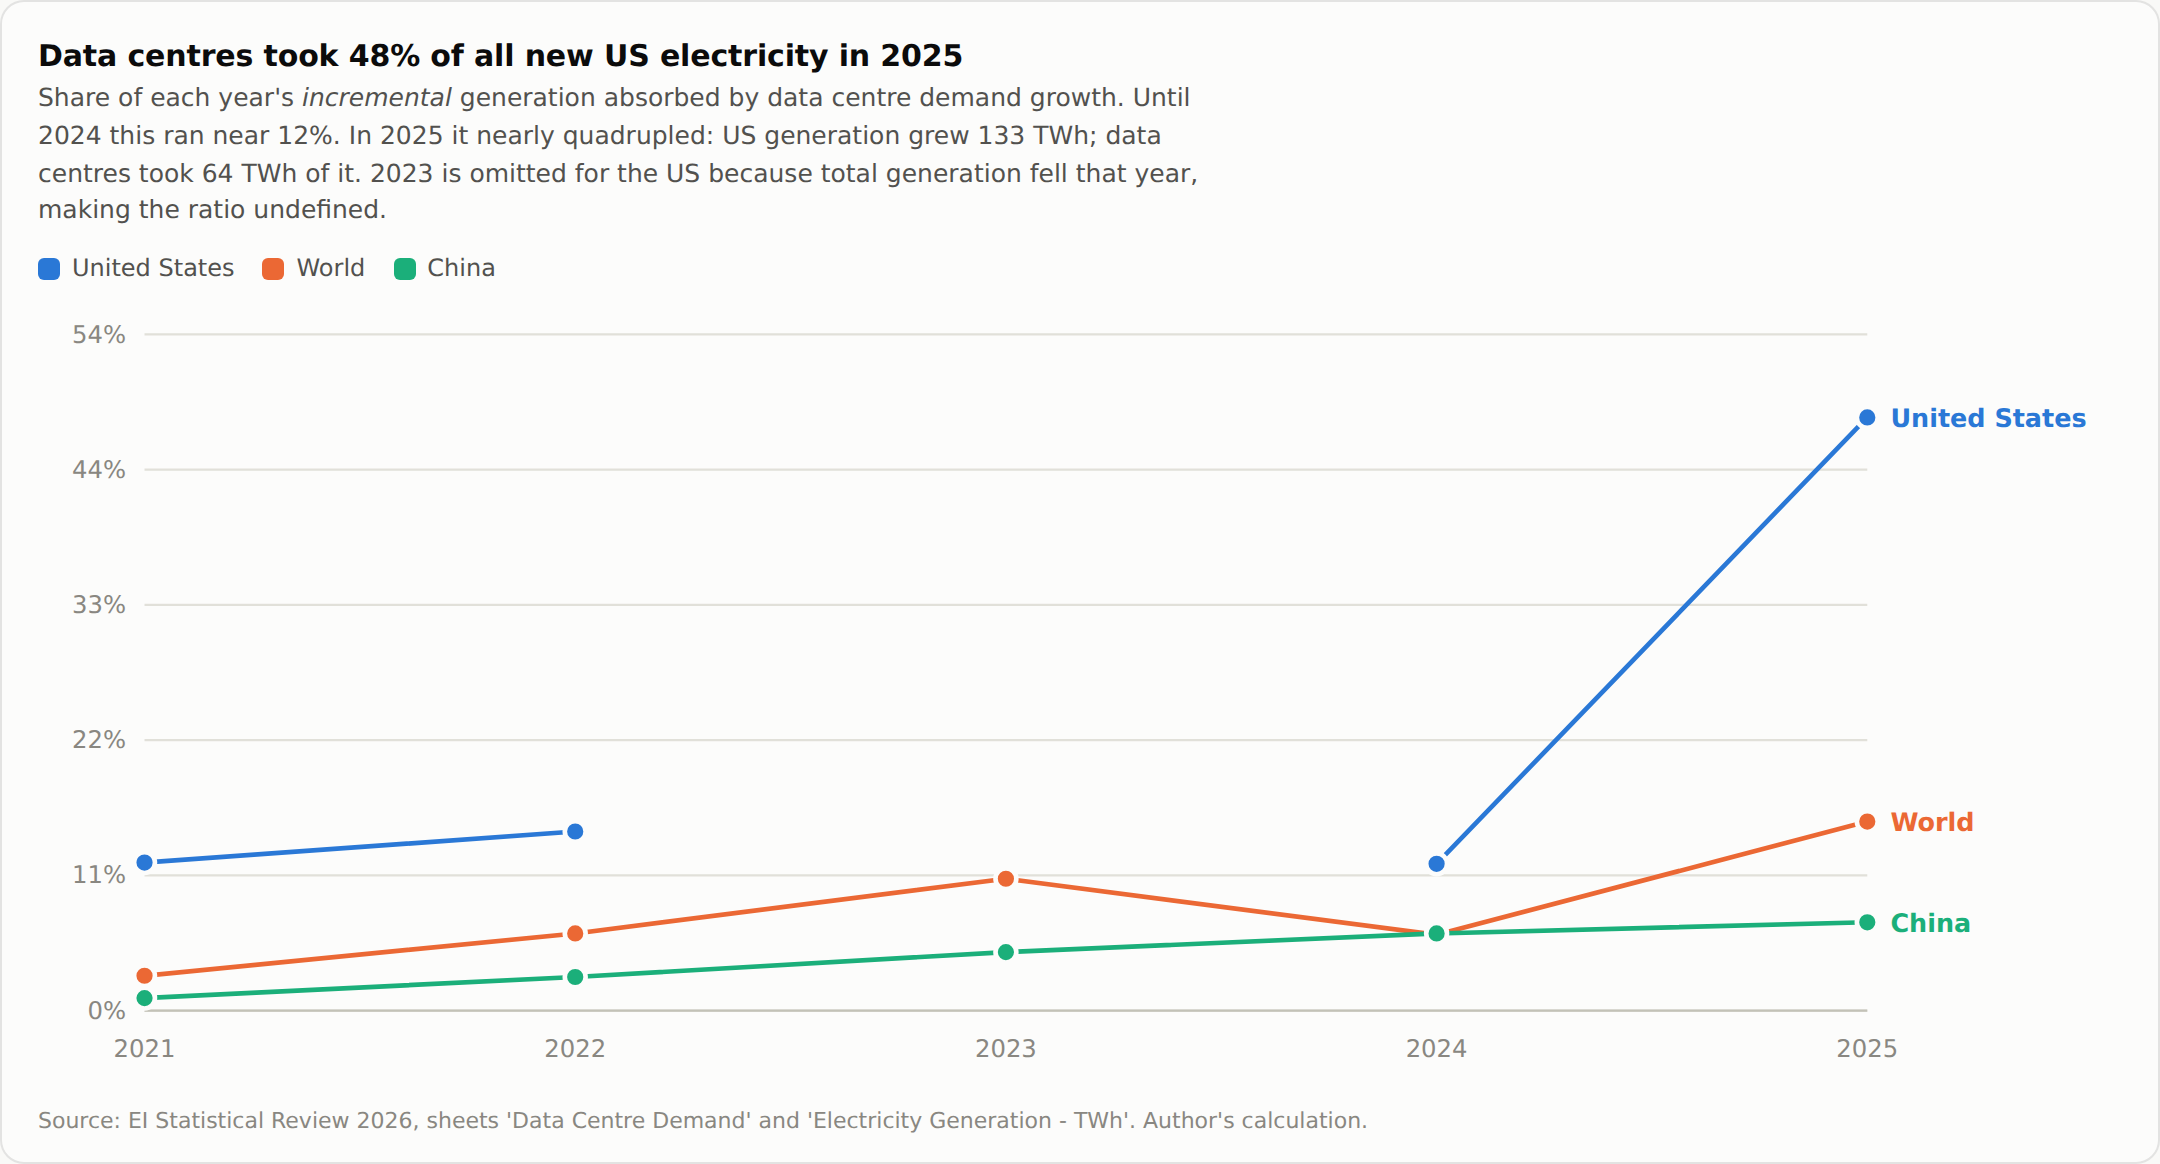
Levels are still modest. American data centers used 313 TWh last year; American air conditioning, residential and commercial together, used roughly 390 TWh. At 2025 growth rates the servers pass the air conditioners around 2028.
The stress is entirely in the derivative, and derivatives are where assets reprice.
Headroom, not size
Absolute generation is the number everyone quotes and the least useful one on the page. China generated 10,575 TWh in 2025 against America's 4,772, and the gap has widened every year since 2010. It tells you almost nothing about where a gigawatt of new load can go.
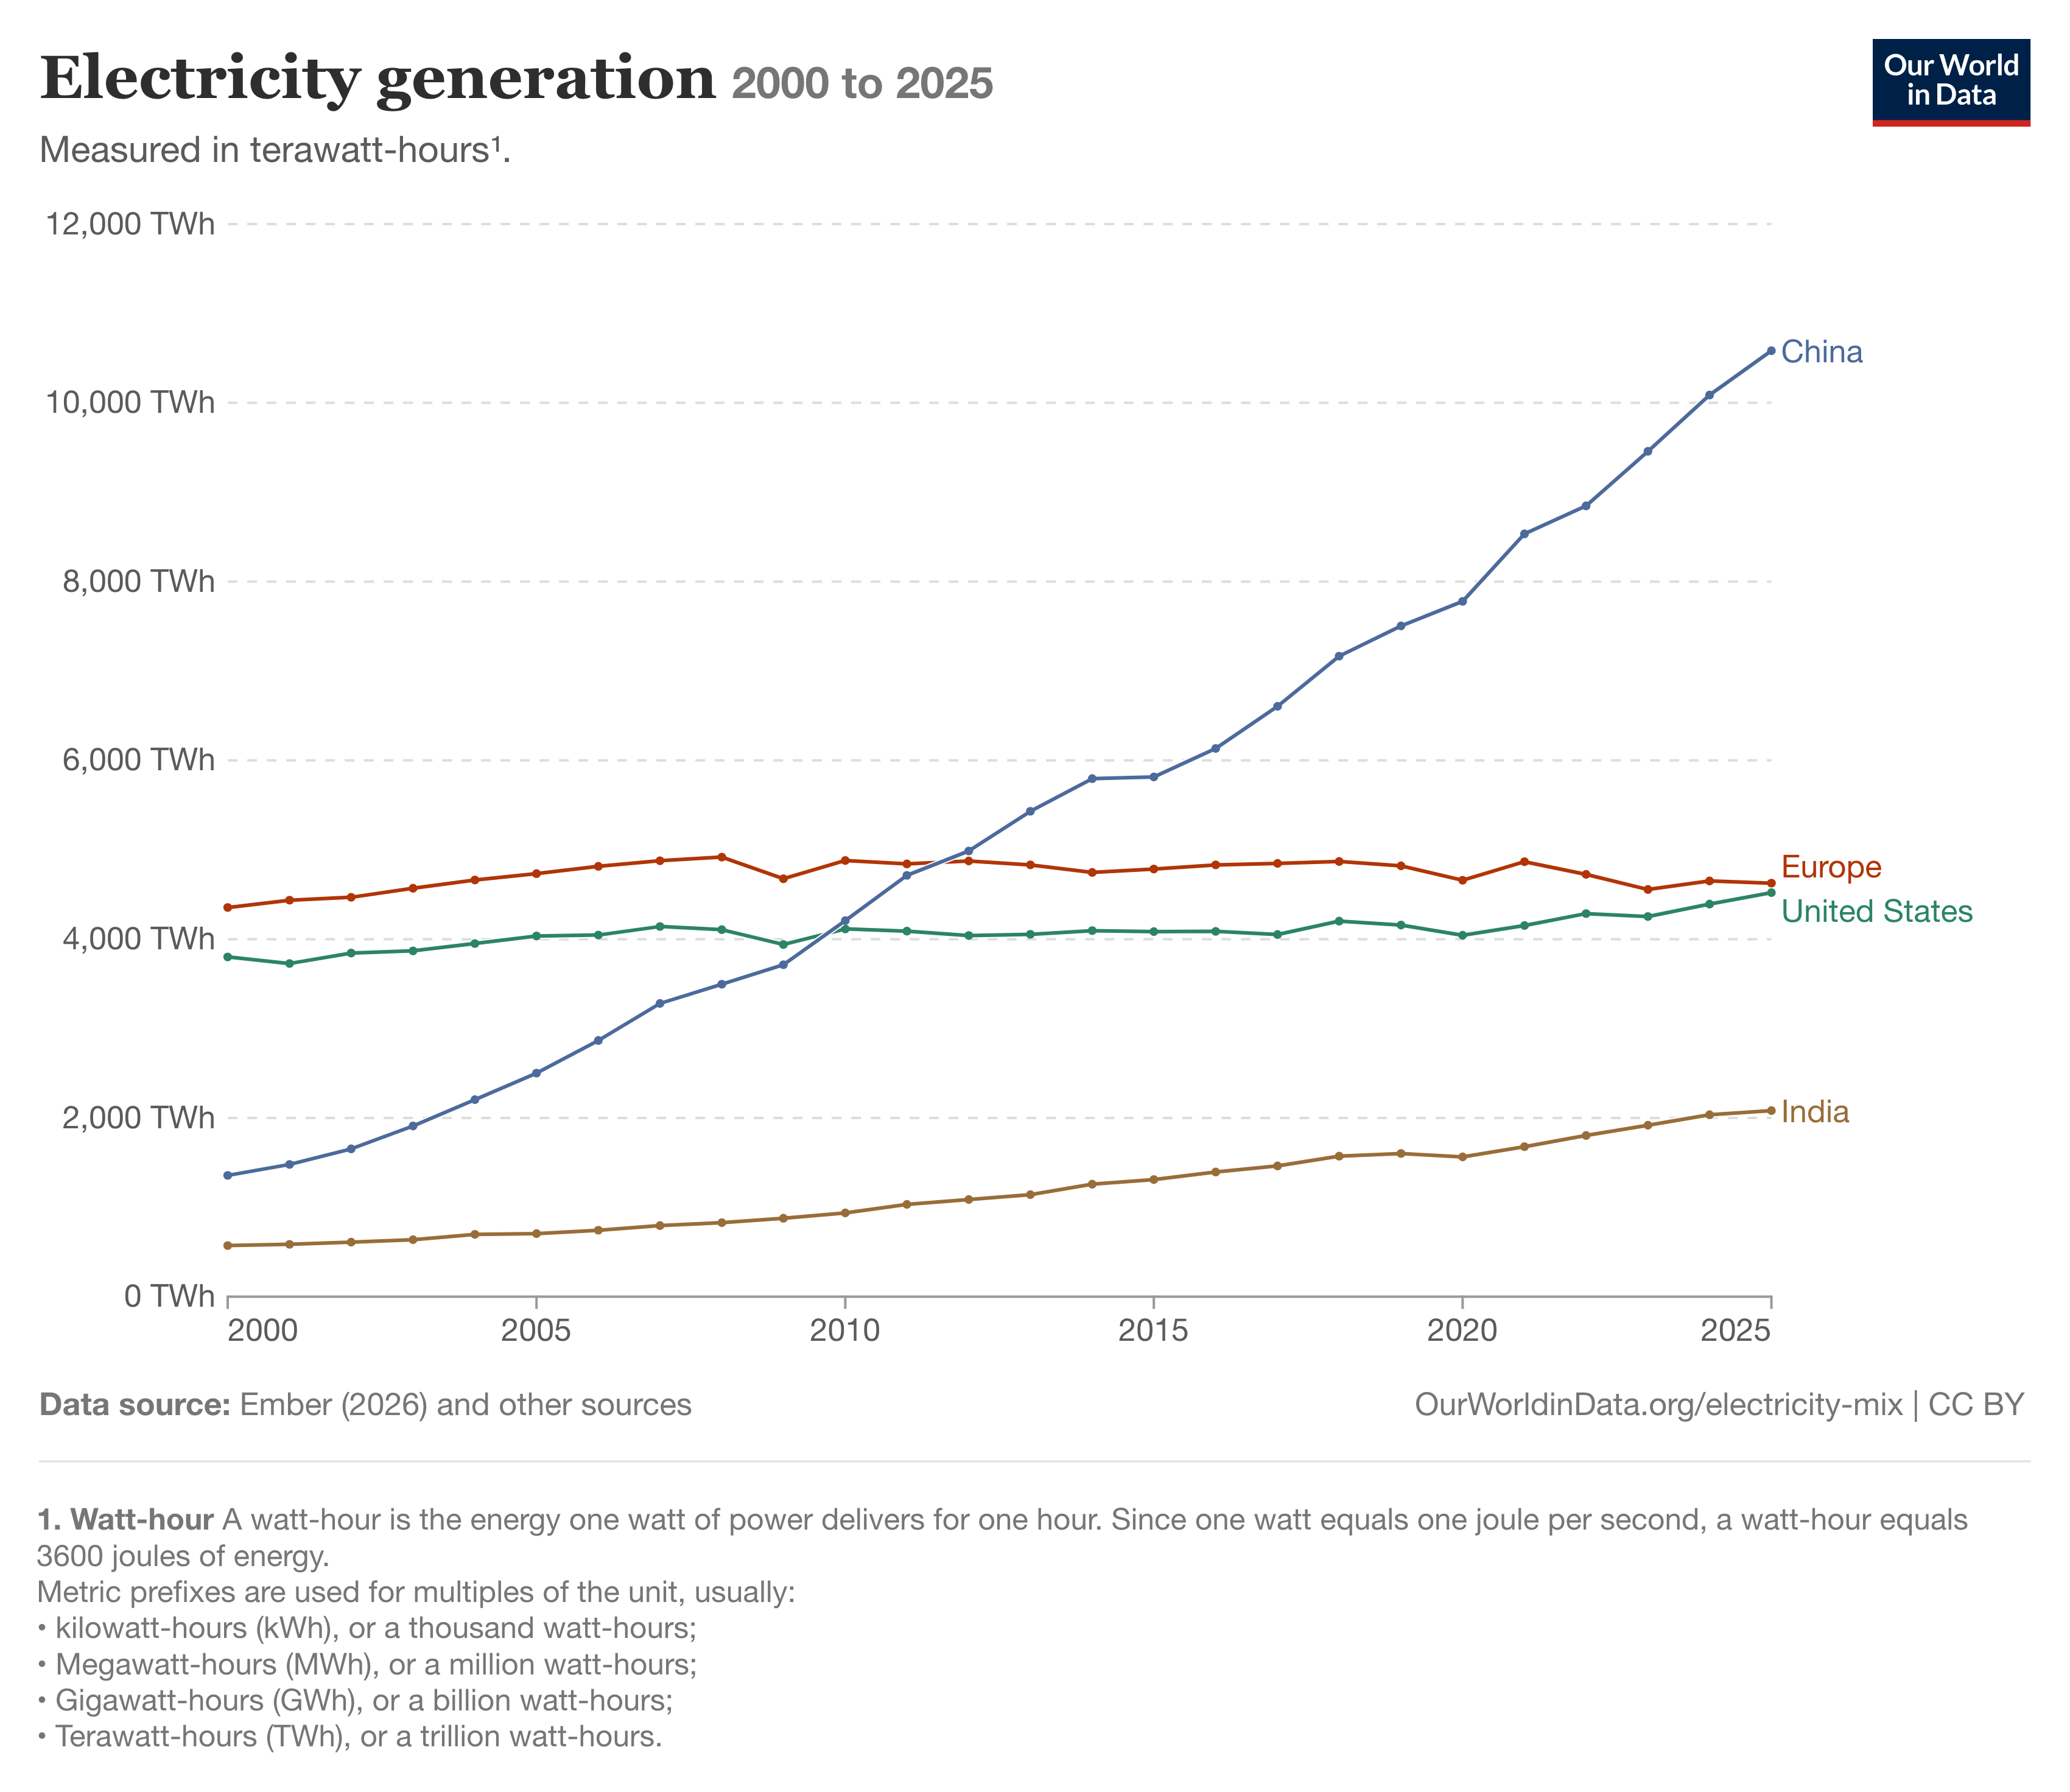
Annual growth tells you everything:
| Electricity generation added (TWh) | 2022 | 2023 | 2024 | 2025 |
|---|---|---|---|---|
| China | 315 | 608 | 631 | 488 |
| United States | 137 | −39 | 140 | 133 |
| India | 123 | 120 | 111 | 19 |
| Europe | −144 | −85 | 84 | 52 |
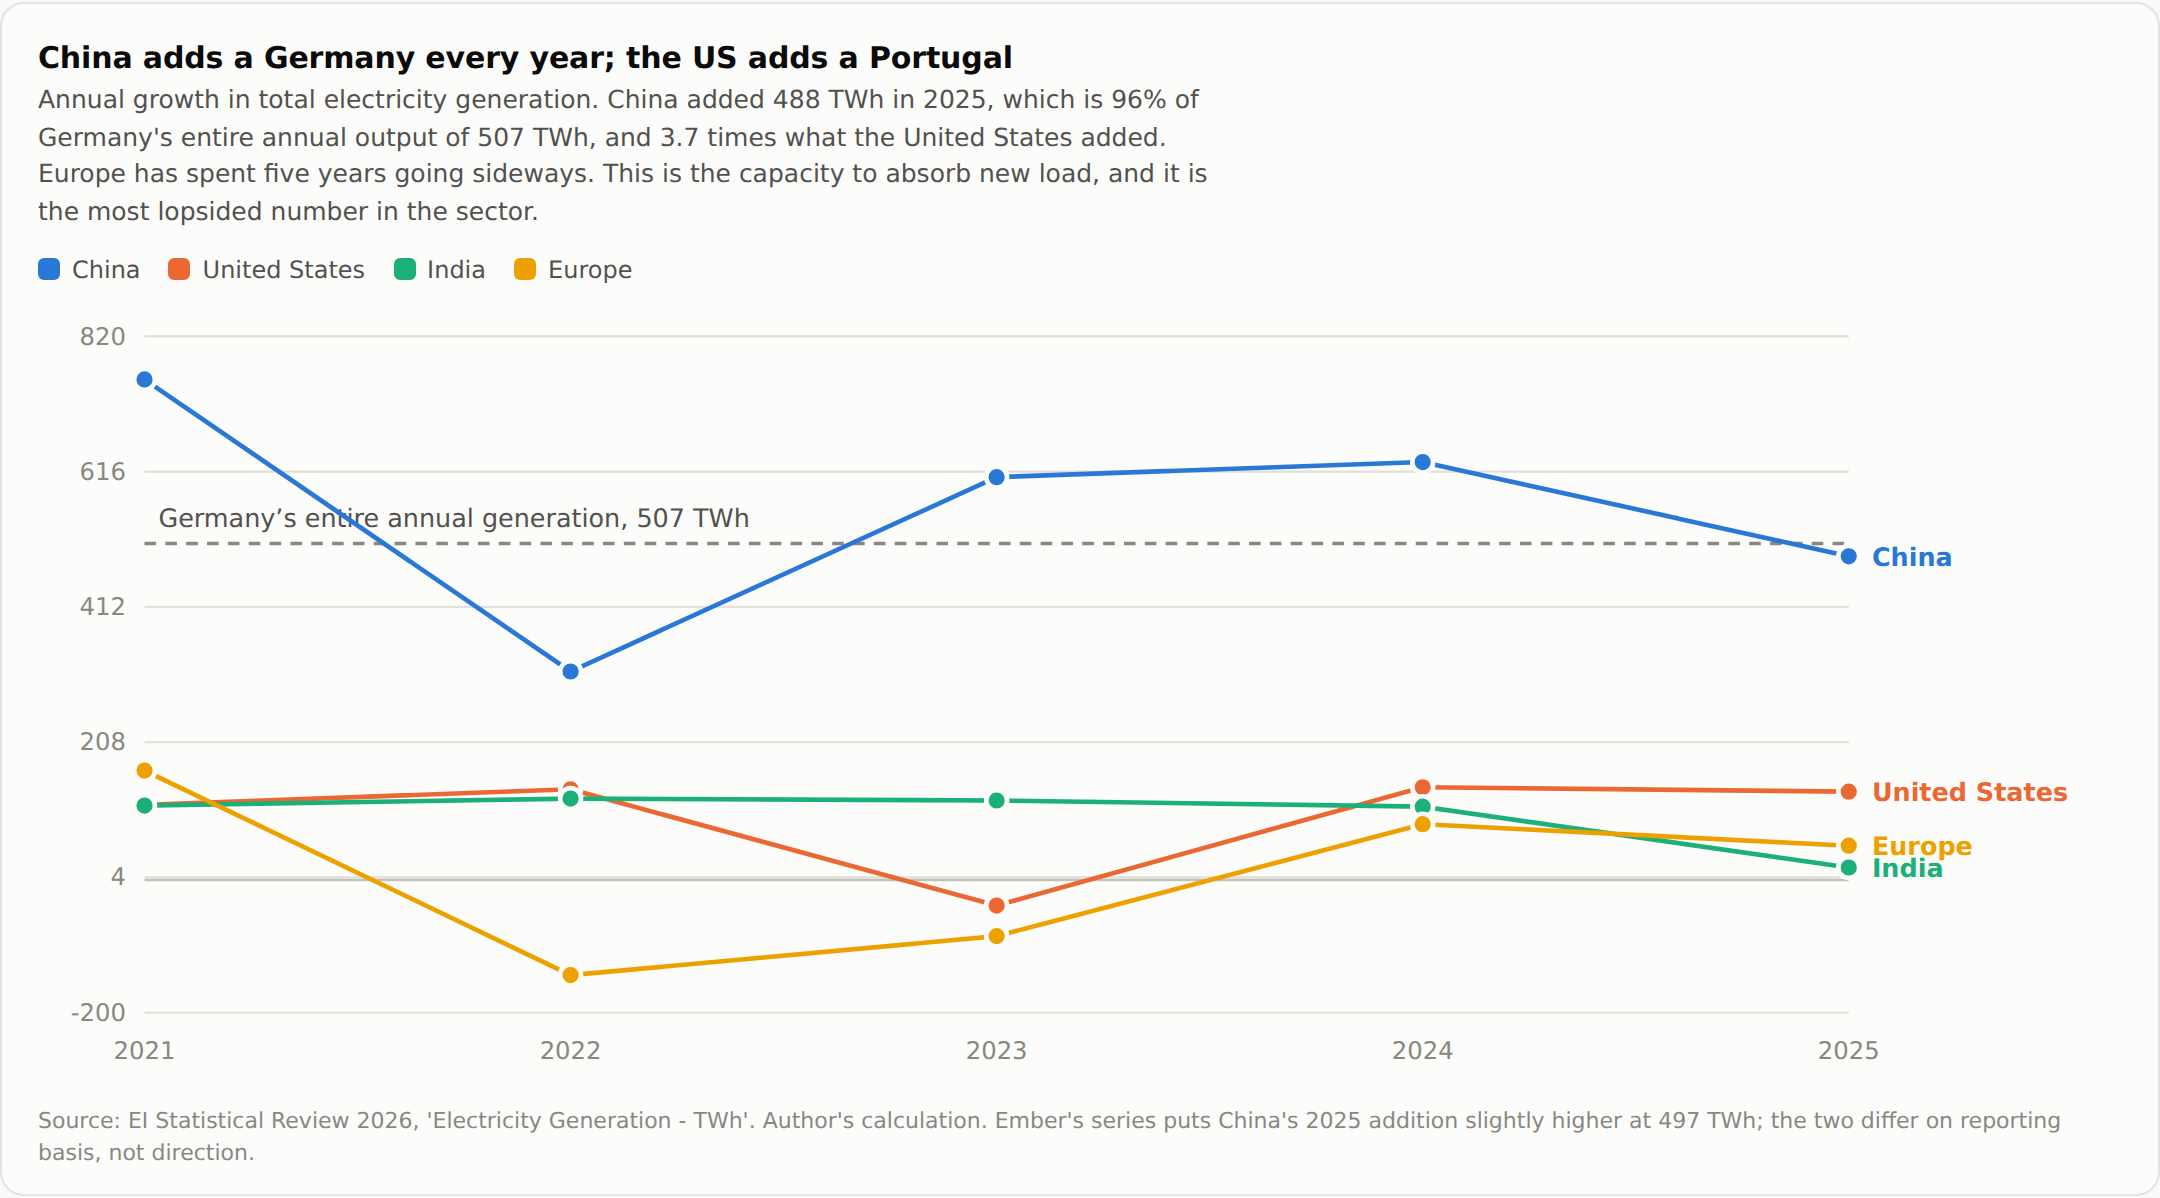
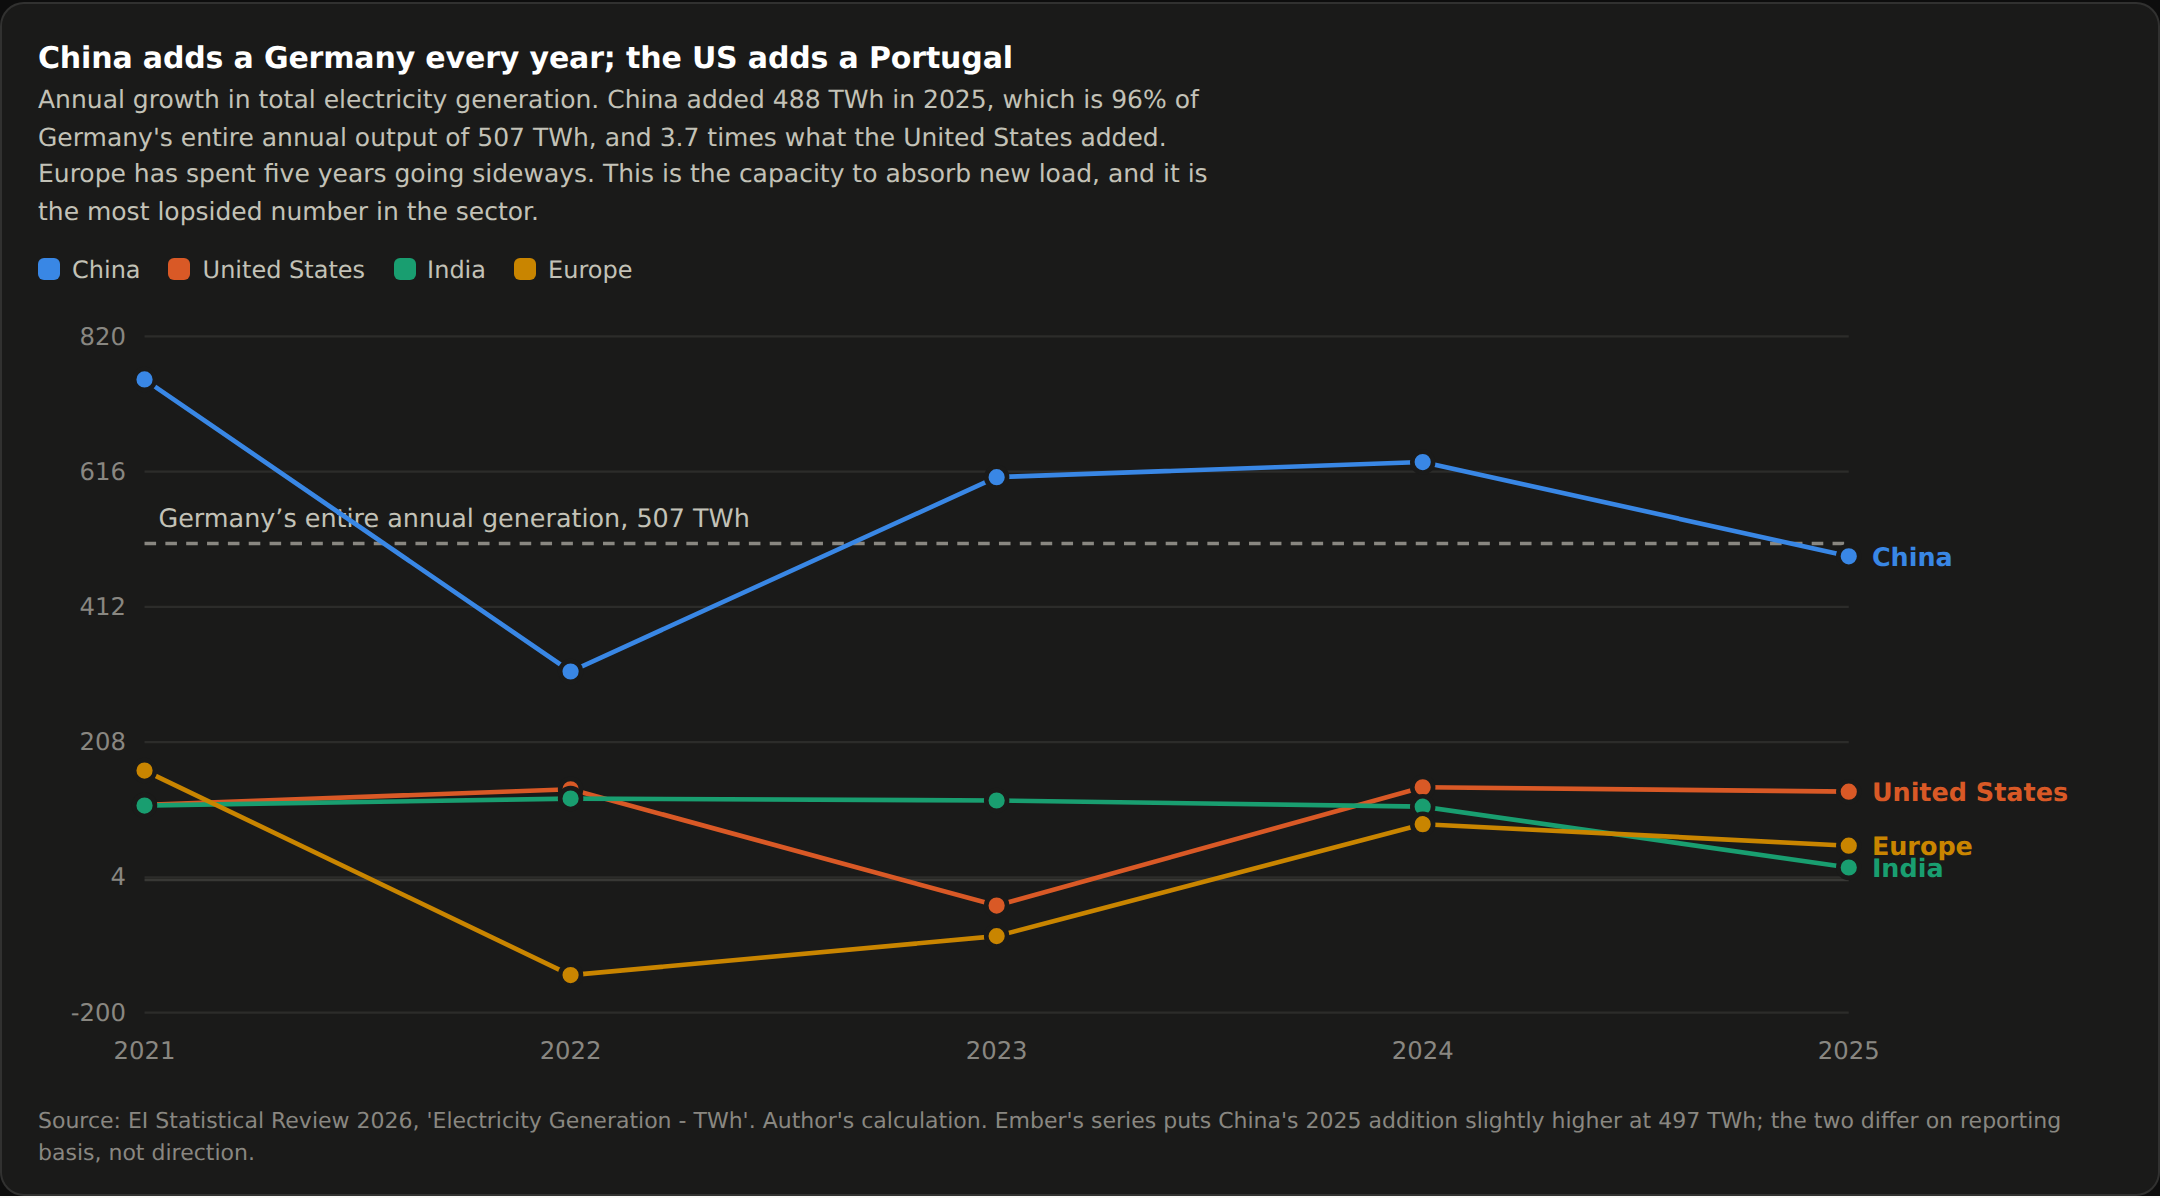
China added 488 TWh last year, and Ember's parallel series puts it at 497. Germany's entire annual output is 507 TWh. China adds a Germany a year; the United States adds something closer to a Portugal. Europe has gone sideways for five years, with outright contractions in 2022 and 2023.
Now put the two derivatives together, because this is where the asymmetry lives:
| 2025 | Generation added | Data center growth | Share of new supply consumed |
|---|---|---|---|
| China | 488 TWh | 35 TWh | 7% |
| United States | 133 TWh | 64 TWh | 48% |
China is not advantaged because it generates more electricity. Its advantaged because it adds new electricity roughly fourteen times faster than its digital economy consumes it, while America adds it barely twice as fast. On current run-rates the US would have to nearly quadruple its pace of generation growth to give data centers the slack China already has.
Two caveats.
One other important factor is that China's additional capacity is almost entirely variable. Solar contributed 334 TWh of the 488 and wind 131, which is 95% between them; coal, gas, and the rest were net negative. At China's realized 12.8% solar capacity factor, 334 TWh of new solar generation required something like 300 GW of new panel. The energy is real. So is the balancing problem, which is exactly why China is simultaneously running 45 ultra-high-voltage projects and holding an enormous coal fleet at low utilization as the swing resource.
Which is the same conversion-layer argument seen from the other side. China's edge is not fuel, and it is not even generation in the abstract. Its that China can manufacture the nameplate, build the wires to move it, and hold firm backup to balance it, in roughly two years from approval. The American stack is not longer because America has less coal.
The read-through for capital: the geographic question isn't who has the biggest grid. Its whose marginal megawatt is cheapest to add, and who has slack to hand it to compute. The US answer is a cheap molecule behind a slow delivery system, which is why the American build-out routes behind the meter. China's answer is an expensive molecule behind a fast delivery system, which is why its build-out routes through the grid.
The unit problem
Four different things get called a gigawatt. End to end they differ by a factor of six.
| Layer | What it means | Ratio |
|---|---|---|
| Utility / interconnect capacity | What the site may draw. The press release number | 100% |
| Critical IT load | Power to compute after cooling and conversion. The unit a lease prices in | 35–70%, median ~67% |
| Facility capacity | IT load × PUE, the ratio of total facility draw to compute draw. The IEA's "installed capacity" | ×1.13–1.38 |
| Average grid draw | What the system actually sees. TWh ÷ 8,760 | ×48% on IEA fleet observation |
Hut 8's Beacon Point is 1,000 MW of utility capacity against 352 MW of contracted critical IT load, a ratio of 35%. The disclosure asymmetry is structural rather than sloppy: a colo landlord signing a triple-net lease has to state IT load because thats how the capital is priced, while a hyperscaler building for itself has no counterparty and quotes site power.
So when you read "a 1 GW campus," the honest translation is somewhere between 170 MW and 700 MW of average grid draw. Any model that treats the headline as load is overstated somewhere between 2-6x.
The assumption nobody varies
The IEA holds data center load factor at 48% from 2023 through 2035 in all four of its published cases. Dominion reported 82% for large Virginia data centers. Duke plans new large loads at 80%. Some utility filings assume 95 to 100%.
| IEA scenario | At 48% (IEA) | At 70% |
|---|---|---|
| 2030 Base, 226 GW | 950 TWh | 1,386 TWh |
| 2035 Base, 277 GW | 1,193 TWh | 1,699 TWh |
| 2035 Lift-Off, 383 GW | 1,637 TWh | 2,349 TWh |
The IEA's central capacity at an observed load factor produces more demand than the IEA's own Lift-Off Case. The entire published spread between bull and bear is smaller than the effect of one number that never moves. Anyone who runs power screens catches this, and it is the first question to put to any forecast in the sector.
The conversion haircut
Seven independent bottom-up counts of announced versus deliverable capacity:
| Source | Announced | Deliverable | Conversion |
|---|---|---|---|
| Janus Henderson (US, to 2030) | 157.4 GW | 84.7 GW | 54% |
| Goldman Sachs (to 2028) | scheduled capacity | ~half on time | ~50% |
| SemiAnalysis (2026 US pipeline) | 12–16 GW | ~5 GW under construction | ~35% |
| Exelon (its own pipeline, screened) | 65 GW | 20 GW high-probability | 31% |
| ERCOT (its own published haircut) | 100 MW requested | 27.6 MW planned for | 28% |
| East Daley (behind-the-meter gas, risked site by site) | 8.5 Bcf/d | 1.43 Bcf/d | 17% |
| Bessemer (operational today) | 190 GW / 777 projects | ~12 GW | ~6% |
They disagree about nearly everything else, and the five forward-looking counts converge on 28 to 54%. Read the last two rows as a floor rather than a forecast: Bessemer is measuring what is running today against everything ever announced, and East Daley is risking behind-the-meter gas site by site, which is the harshest test anyone applies. OpenAI has more than 10 GW contracted and 1.9 GW live. Exelon's book has since shrunk on both sides: by Q2 2026 it was carrying 11 GW of high-probability load against a 25 GW pipeline. The ratio improved, from 31% to 44%, because the speculative tail fell away faster than the real projects did. The absolute number nearly halved.
Apply the haircut before the multiple. Most of the "AI power" equity complex is priced on announced gigawatts.
The workings
One chain with two soft assumptions is a guess with a table attached. So instead of deriving the number once, I derived it three ways that share almost no inputs, plus one internal consistency test, and looked at where they land.
Route one: extrapolate what actually happened. US data center demand compounded at 12.6% a year from 2020 to 2025 and printed 25.5% in 2025 alone. Hold the five-year CAGR and you get 566 TWh by 2030. At 15% you get 629.
The internal test: the share of new supply. Data centers took 47.7% of all incremental US generation last year. Hold that at 40 to 46% against 133 TWh a year of grid growth and you get 579 to 618 TWh. This is not an independent route, and I want to be explicit about that, because it's the same equation as the first check below solved in the opposite direction. It tells you whether the answer is internally coherent, not whether it is right.
Route two: the bottom-up ledger. Janus Henderson tracked 259 discrete projects, filtered for signed interconnection agreements, verified behind-the-meter generation, and physical evidence of construction, and put 84.7 GW of the announced 157.4 GW as actually deliverable by 2030, a 54% conversion rate.
Here I have to flag an ambiguity rather than paper over it, because it moves the answer. Janus doesn't state unambiguously whether those gigawatts are data center interconnect capacity or the nameplate of the generation being built to serve it. IMHO you should read it as data center capacity, and running it through the unit stack at a 55% IT-load ratio, a PUE of 1.15, and a 65% load factor, it gives 618 TWh. Read as generation nameplate at a 55% capacity factor, it gives 721. The first reading fits the language of the ledger better. The second is why I don't lean on this route alone.
Route three: what everyone else says. The IEA has 426 TWh on a boundary that excludes crypto, so roughly 506 like-for-like. BNEF has 118 GW and 12% of US electricity, about 652. EPRI spans 380 to 790.
Take the midpoint of each genuinely independent route and you get 598 from the trend, 670 from the ledger, and 579 from the published work. Median 598. Mean 615.
So: a base case of roughly 615 TWh, and a defensible band of 510 to 740, or 9.4% to 13.6% of US electricity. Note where 615 sits: at the upper end of what the independent routes center on, not in the middle of it. If you want the conservative read, take 600 and the argument does not change.
And now the checks, because a forecast that won't reconcile with the rest of my analysis is nothing but a guess wearing a table.
It implies data centers keep taking 46% of all incremental US generation through 2030, against a 2025 actual of 47.7%. So the central case reduces to one sentence: last year was not a spike, it was the run-rate. Treat this as a coherence test rather than corroboration, for the reason given above.
It implies 2.0 to 2.9 Bcf/d of incremental gas demand, taking 35 to 50% of the increment as gas-served. The published bottom-up band is 2 to 6 Bcf/d. I land at the bottom, which is where a 54% conversion haircut ought to put you.
It implies 15 GW a year of new nameplate generation for data centers alone at a 45% blended capacity factor. EPRI models 6.6 to 13.7 GW a year of new gas alone under reference policy. Consistent, and tight enough to be uncomfortable.
And one external check on the assumption that does most of the work here. Epoch AI's cost model, built for an entirely different purpose, assumes a 71% utilization rate for a hyperscaler AI facility, from an average of four independent estimates. My central case uses 65%. If Epoch is closer, my number is low.
Why the wide band doesn't matter
The band is wide, but it doesnt matter. At the bottom, 510 TWh, data centers take 30% of all new US generation between now and 2030 and reach 9.4% of American electricity. At the top, 740 TWh, they take about 64% of new supply and reach 13.6%. Those are different worlds for anyone underwriting a specific utility, but they're the same world for this analysis.
Run the fuel arithmetic across the entire band and incremental gas demand moves from 1.4 to 4.1 Bcf/d. Every point in that range sits inside the published 2 to 6 Bcf/d estimates. Every point sits below what US liquefaction adds over the same period. There is no corner of the range, including assumptions more aggressive than anyone publishes, where American gas supply becomes the binding constraint.
That's worth stating plainly because it's the rare case where widening the error bars strengthens the conclusion. The demand uncertainty here is real, large, and irrelevant to the question this piece is asking. What binds is not sensitive to which of these worlds we get.
It also puts me a long way below the number most people have absorbed. Power 2026, which I lean on later for market mechanics and which is currently the most widely read popular primer in this space, works from data center demand doubling every two years, and points out that on that path it would outrun total US generation by the mid-2030s. Somani uses the doubling to show the trajectory has to break rather than to forecast it, and he is right that it has to. My central case implies a doubling every 5 years instead of every 2. Thats where I think it breaks.
Which leaves the disagreement with the IEA on one variable, and it's not demand - its the load factor. If the fleet really does run at 48% through 2035 then the IEA is right and I am too high. If new AI capacity runs anywhere near what Dominion already measures on the ground in Virginia, then everyone named above is too low, including me.
II. The fuel isn't the problem
What's in the ground
| Fuel | Reserves | R/P (years) |
|---|---|---|
| Coal, world | 1,074,108 Mt | 139 |
| Coal, United States | 248,941 Mt | 514 |
| Coal, China | 143,197 Mt | 37 |
| Natural gas, world | 188.1 Tcm | 49 |
| Natural gas, Middle East | 75.8 Tcm (40% of world) | 110 |
| Natural gas, Russia | 37.4 Tcm (20%) | 59 |
| Oil, world | 1,732 bn bbl | 53 |
| Oil, Middle East | 836 bn bbl (48%) | 83 |
Nothing there describes a fuel shortage for a load running at 2.45% of world electricity.
One data-source note, for anyone maintaining these series. The Energy Institute has stopped updating proved oil and gas reserves; both the 2025 and 2026 editions carry the same line, that the reserves tables have not been updated this year. Those figures are end-2020. For US gas the EIA is now the only live source, annual, roughly a fifteen-month lag, and its year-end 2024 report landed on 7 April 2026: dry proved reserves of 545.4 Tcf, wet reserves down 3.3% year over year, shale gas proved reserves at 379.4 Tcf and the lowest since 2021. Reserve replacement came in under 100% while production rose about 1%.
What actually filled the gap
Three things closed a hole that peaked at 11.2 million barrels a day of shut-in production, and only one of them is repeatable.
Demand destruction did the most work. The IEA now has global oil demand falling almost 5 mb/d year-on-year in the second quarter and 1.1 mb/d for the full year, against a pre-war forecast of 850,000 b/d of growth. That is roughly 45% of the peak gap, and it is not elasticity in any comfortable sense. It is people in the Asia-Pacific buying less fuel because they could not afford it.
Stock draws did about a third. Global inventories fell 3.8 mb/d on average across the conflict. Inside that sits the largest emergency release in the IEA's history: 400 million barrels agreed on 11 March by 32 member countries, the sixth collective action since 1974 and bigger than all five predecessors. The American share was 172.2 million barrels from the Strategic Petroleum Reserve, released over roughly 120 days, which works out at about 1.43 mb/d, or 13% of the peak gap.
Rerouting and substitution did the rest, via Gulf producers using pipelines that bypass the strait, a surge in US crude exports, and a refining system that reconfigured to replace both Middle Eastern crude and the region's lost product exports.
Now the part that should worry anyone extrapolating from this recent chaotic episode. The SPR stood near 415 million barrels before the war. It is 298.7 million now, the lowest since January 1983, and lands near 243 million when the release completes. The GAO reported in May that more than a quarter of the inventory was unavailable for drawdown because of construction and cavern outages, which implies roughly 103 million barrels that cannot be moved at all, and quoted Energy Department officials describing the infrastructure as held together "with Band-Aids." Below 300 million, analysts warn the reserve loses the ability to pump at emergency speed.
So the honest read of the buffer is not 298 million barrels. The Energy Department puts the minimum needed to operate the reserve at all at about 70 million barrels, which leaves at most 173 million deployable at the 243 million endpoint, and the GAO's outage finding takes a further bite out of that. Net it out and roughly 100 million barrels of genuinely usable emergency supply survive the episode, on a reserve that held 415 million in March.
The system absorbed the largest supply disruption in the history of the oil market, which is the point I'm making about fuel. It absorbed it by spending a reserve built over fifty years and by pricing several million barrels a day of consumption out of the market. Neither is available a second time on the same terms. If you are holding the view that fuel supply is not the binding constraint, and I am, then the correct version of that view is that fuel supply was not the binding constraint for most of 2026, but its shock absorbers are now largely spent.
Note the structure, though, because it cuts the other way. The American release is a loan rather than a sale: roughly 133 million barrels lent to companies for repayment in crude at premiums of up to 24%, with a further 40 million barrels due back once the conflict ends. On paper the reserve refills at a profit. On the evidence of the last two refills, I would not underwrite the timing.
The R/P compass, run forward
The reserve-to-production ratio is still the right compass for this sector. The useful exercise now is running it forward rather than backward. Starting from 545.4 Tcf and modeling R(t+1) = R(t) + (RRR − 1) × P(t) across three production paths and three reserve-replacement rates:
| 2035 R/P | RRR 100% | RRR 85% | RRR 70% |
|---|---|---|---|
| Constrained demand (104→113→118 Bcf/d) | 12.7 | 11.1 | 9.5 |
| Base, LNG-led (104→120→130) | 11.5 | 10.0 | 8.5 |
| AI + full LNG (104→132→145) | 10.3 | 8.9 | 7.4 |
The ratio falls below 10 years by 2035 in five of the nine cells. Two things fall out of that grid for capital.
Reserve replacement does more work than AI demand. Moving RRR from 100% to 70% costs more years of R/P than moving from the constrained demand path all the way to the aggressive one. And reserve replacement is a function of price and rig allocation, both of which respond inside eighteen months.
Proved reserves are also a price-dependent accounting construct rather than a geological measurement, which is the part most people skip. The 2024 decline happened in a year when Henry Hub averaged $2.19, the lowest since 2020, and a good deal of what leaves the book at $2 walks back in at $5 through positive revisions. The year-end 2025 report, due April 2027, is the real test. 2025 saw firmer prices, so a further decline would be geology rather than accounting. That is a dated, falsifiable checkpoint; diarize it.
The resource base keeps replenishing on harder terms, too. bp's Bumerangue well in the Santos Basin, announced last August, carried a 500-meter gross hydrocarbon column across more than 300 square kilometers, the company's largest discovery in 25 years, and arrived with enough CO2 that it will have to be managed or reinjected. Deeper, sourer, further from load. Existence was never the constraint. Cost and clock are.
The geography is the trade
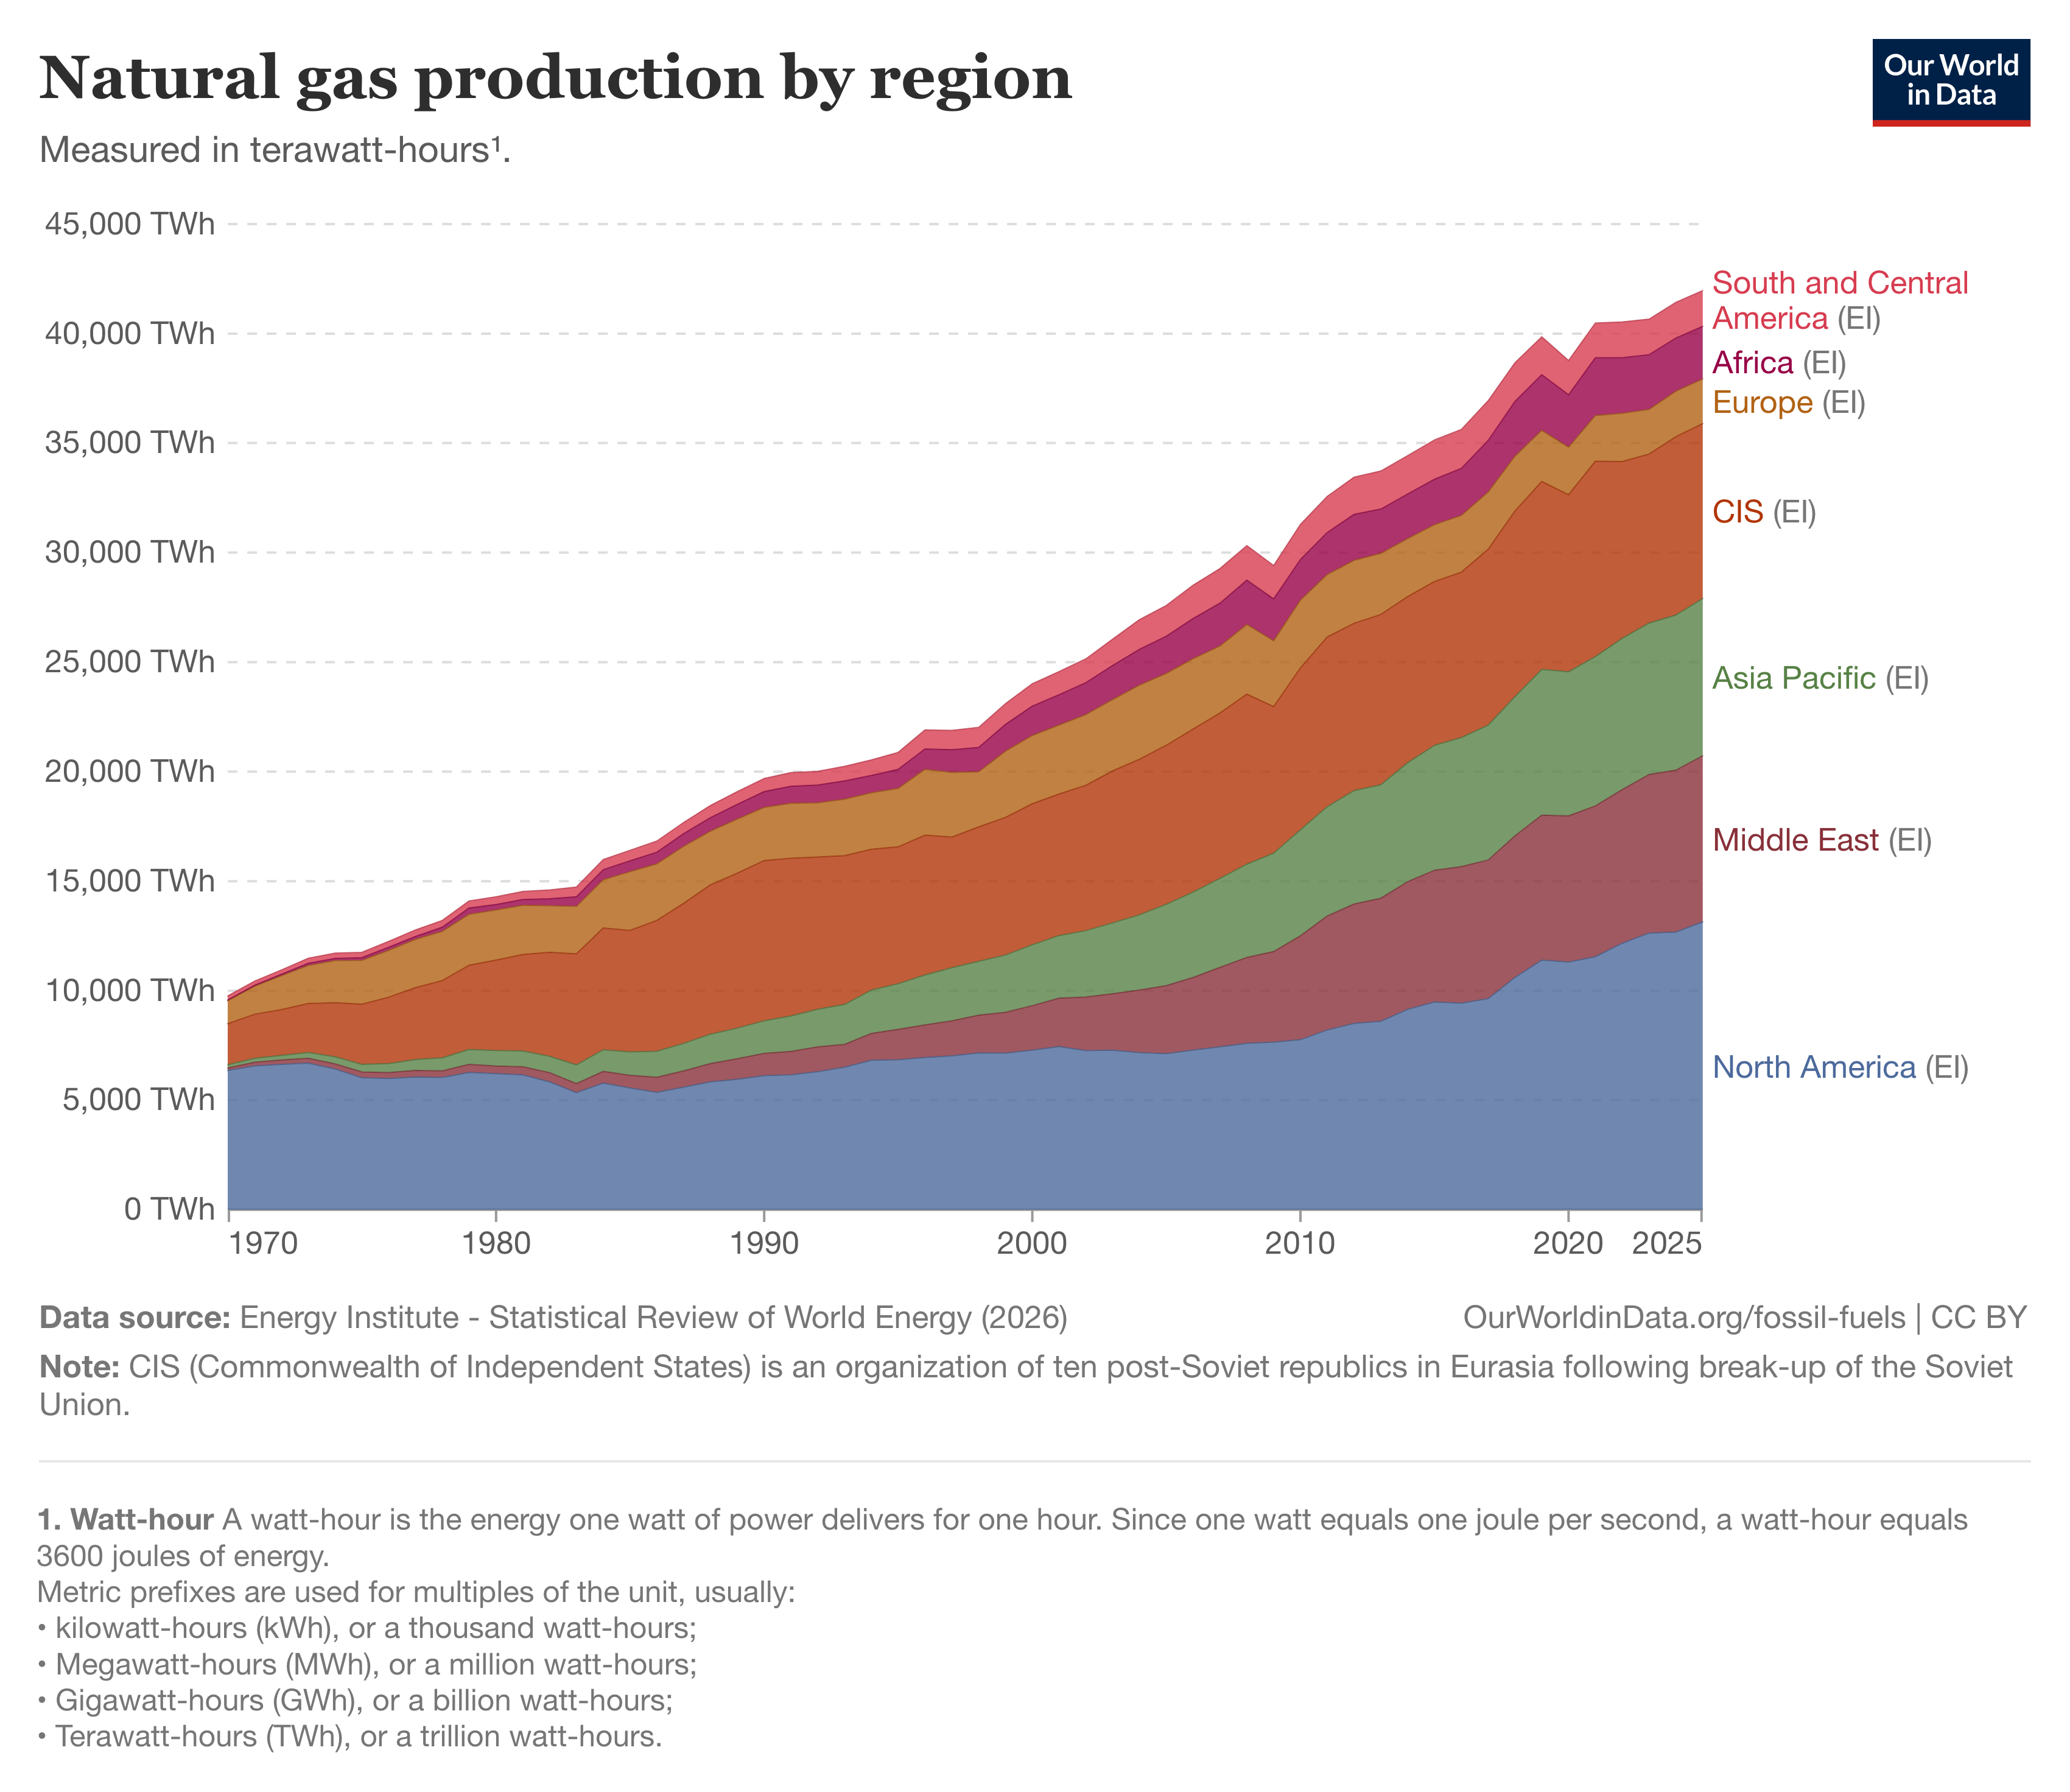
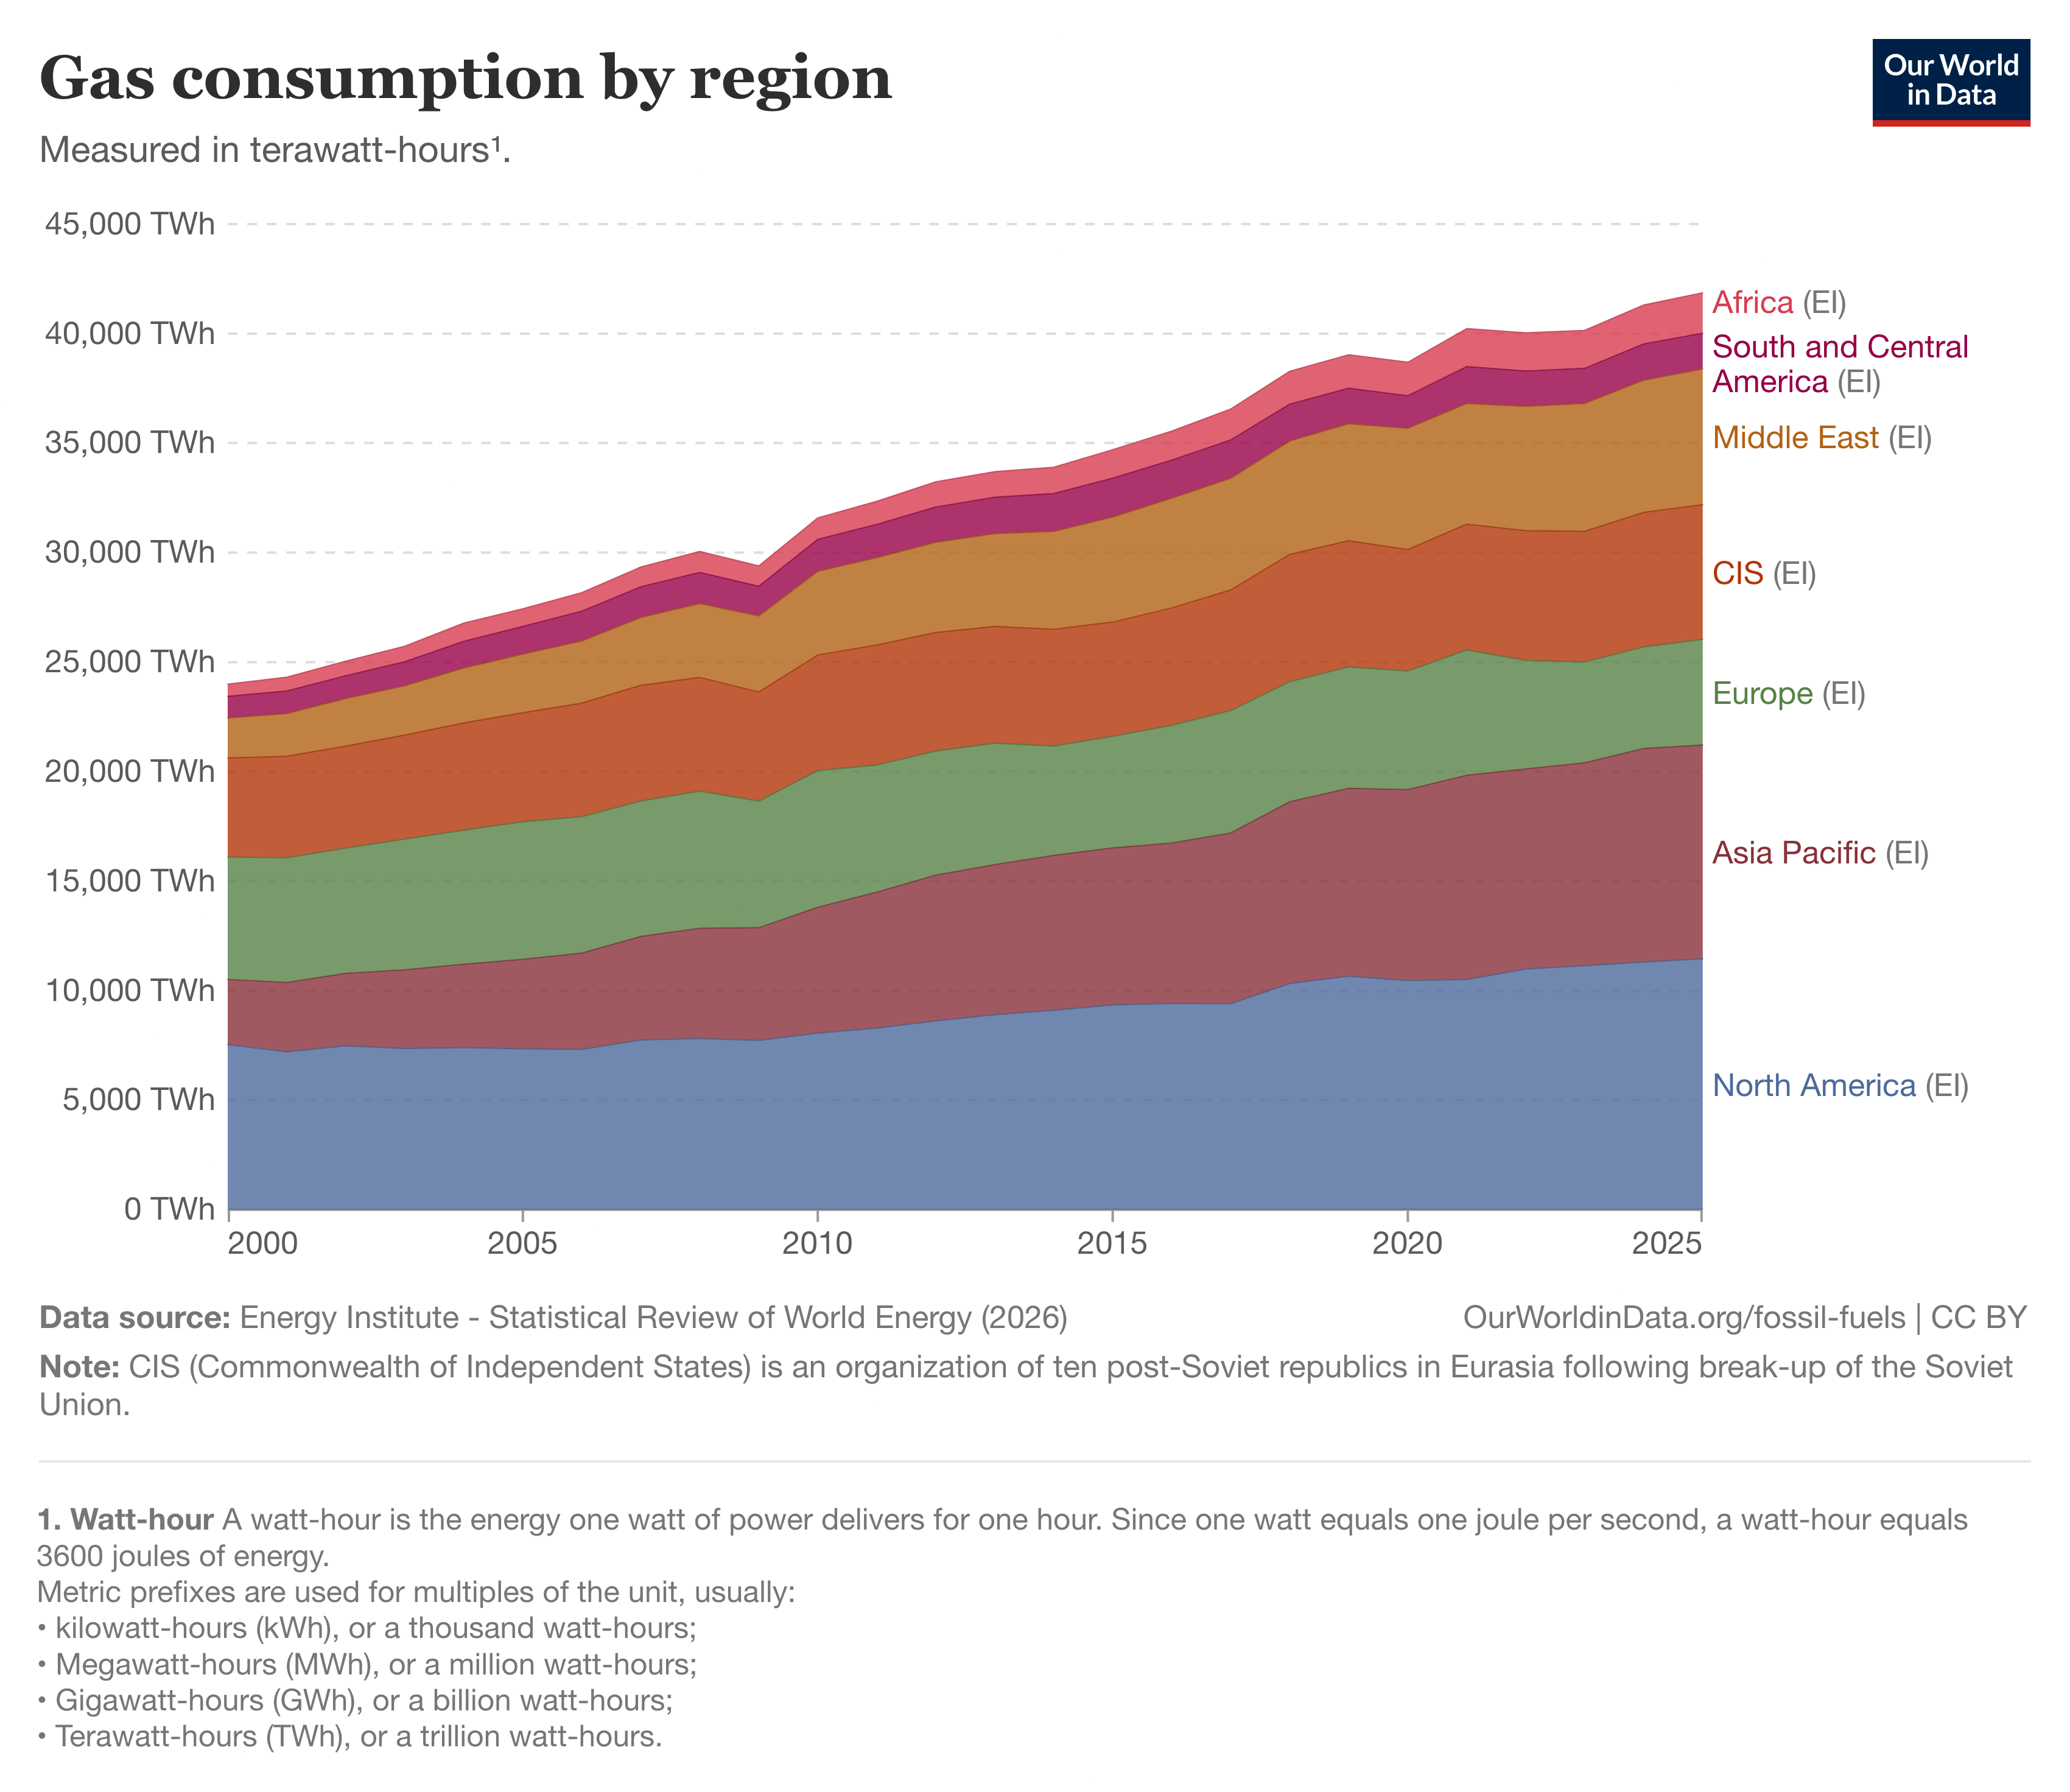
Production minus consumption, 2025, natural gas:
Europe and Asia Pacific are each short by roughly a quarter of a trillion cubic meters a year, and the deficit moves by ship through a handful of chokepoints. World LNG trade was 578.5 Bcm in 2025, about 56 Bcf/d. US exports were 147 Bcm, 14.2 Bcf/d, from essentially nothing a decade ago.
Which produces the price fact that drives most of what follows:
| Benchmark | Early August 2026 |
|---|---|
| Henry Hub | $2.60/MMBtu |
| TTF (Europe) | $18.80/MMBtu |
| JKM (Asia) | ~$21/MMBtu |
An eight-fold spread, with the strait closed. The EIA's August Short-Term Energy Outlook carries Henry Hub at $3.44 for 2026 and $3.31 for 2027, so the forward is firmer than spot, and nothing in it closes a gap that size.
American gas is not cheap because of a global glut. It is cheap because its stranded behind insufficient liquefaction and pipe, which is a durable physical fact rather than an arbitrage waiting to close.
This is the deepest structural reason compute is landing in Texas, Louisiana, and Appalachia rather than Frankfurt or Osaka. The marginal molecule cannot leave, so the marginal megawatt is cheap. It advantages US-sited compute, US gas-fired generators, and the whole liquefaction chain, and it disadvantages every European and Japanese build. Note also the scale of the competing claim. US LNG exports run 17.0 Bcf/d in 2026 and 18.5 Bcf/d in 2027 on EIA's forecast, against peak export capacity of 18.3 Bcf/d today and roughly 5.7 Bcf/d more under construction through 2027.
Converting the ask into fuel
One gigawatt of continuous load on a good combined-cycle gas turbine (CCGT) at 6,400 Btu/kWh and an 85% load factor burns 0.126 Bcf/d. A new H-class unit does better, nearer 6,000. A fleet-average machine at 7,200 burns 0.142; a simple-cycle peaker, 0.207.
| New continuous load on gas | Bcf/d | % of US production | % of world LNG trade |
|---|---|---|---|
| 10 GW | 1.26 | 1.2% | 2.2% |
| 30 GW | 3.78 | 3.6% | 6.8% |
| 60 GW | 7.56 | 7.3% | 13.5% |
The published bottom-up work lands in the same place: East Daley at 4.2 to 6.1 Bcf/d by 2030, S&P Global at 3 with upside to 6, Goldman at 3.3, Kinder Morgan at 3 to 6. My own base case, from the section above, comes in at 2.0 to 2.9.
Now hold that against the other call on the same molecules. EIA has US LNG exports rising from 17.0 Bcf/d in 2026 to 18.5 in 2027, which is 1.5 Bcf/d of incremental demand in a single year. Liquefaction adds more gas demand in one year than data centers add in five. Citi called data centers the smaller call in 2024 and it has survived two years of louder headlines.
III. Source by source
Natural gas
Let's be honest, Gas wins by elimination: it's the only firm, dispatchable, siteable, permittable-in-under-a-decade source at scale. 253 GW of gas now sits in US interconnection queues, up 86% year over year, while solar and wind each fell 19%.
The driver nobody discusses is fiscal rather than technical. EPRI's 2026 modeling diverges sharply from its 2024 modeling, and the cause is not AI: changes to the IRA production and investment tax credits under the 2025 budget bill lowered wind and solar competitiveness against gas. Same load growth, different tax code, materially more gas, with each incremental data center MWh now carrying 0.3 to 0.4 tCO2 under reference policy.
The fuel mix of the build-out is substantially a tax-policy outcome, which makes it a policy-reversal risk rather than a technology risk. Price it accordingly.
Coal
A 514-year reserve-to-production ratio attached to a fleet nobody wants to build. The investable margin here is deferral and utilization, not new capacity.
The EIA counts roughly 4.4 GW of planned 2025 coal retirements pushed into 2026: J.H. Campbell at 1,331 MW, R.M. Schahfer 17 and 18 at 722 MW, South Oak Creek 7 and 8 at 616 MW, largely under DOE emergency orders. Coal retirements in 2025 were the lowest in fifteen years.
The more interesting number is latent. Run the world coal fleet, roughly 2,338 GW at a 51 to 53% capacity factor, up to 70%, and it yields between 3,479 and 3,826 TWh of additional generation. That is four to five times total world data center demand, from plant already built and already connected. Cheapest incremental firm MWh anywhere, available in months.
It is also carbon-intensive and politically exposed, so it surfaces as quiet retirement deferrals instead of announcements. One caution for anyone modeling US 2025 closely: coal added 91.2 TWh last year, but renewables added more at 98.6 TWh, and coal's gain came largely from displacing gas rather than serving net new load.
Globally, coal consumption hit 166.0 EJ in 2025, a record, with China at 92.2 EJ and India at 23.0 EJ and climbing. Coal has not peaked. It has been relocated.
Nuclear
World nuclear generated 2,845 TWh in 2025 at a fleet capacity factor near 82%, the highest of any source. Correct physics for a firm, carbon-free, 24/7 load.
Wrong clock for anything before 2030. Every nuclear megawatt arriving this decade comes from a restart or an uprate, precisely because those carry existing interconnection and skip the queue: Three Mile Island Unit 1 at 835 MW restarting for Microsoft on a 20-year PPA, AWS with Talen at Susquehanna up to 1,920 MW, Google restarting Duane Arnold. SMR offtake commitments went from 25 GW to 45 GW during 2025, first units around 2030 on the optimistic reading.
The fuel cycle is the tighter and less crowded position. Primary uranium mine production has run below reactor requirements for years, plugged with secondary supply that is now largely exhausted. Conversion and enrichment are tighter still: Russia holds a large share of global enrichment capacity, measured in separative work units, the US import ban is phasing in with waivers, and the high-assay low-enriched uranium that advanced reactors need barely exists outside pilot quantities. New enrichment capacity takes most of a decade to build.
If every SMR on paper got built, the fuel to run them is not contracted.
Solar, wind, and storage
Realized capacity factors, computed as annual generation over mean installed capacity:
| 2020 | 2022 | 2023 | 2024 | 2025 | |
|---|---|---|---|---|---|
| World solar | 15.0% | 15.9% | 15.4% | 15.0% | 15.0% |
| World wind | 26.9% | 27.9% | 27.6% | 26.7% | 25.6% |
| US solar | 22.1% | 22.8% | 21.8% | 22.1% | 23.0% |
| US wind | 35.1% | 36.5% | 33.6% | 34.7% | 34.4% |
| China solar | 13.0% | 13.9% | 13.3% | 12.8% | 12.8% |
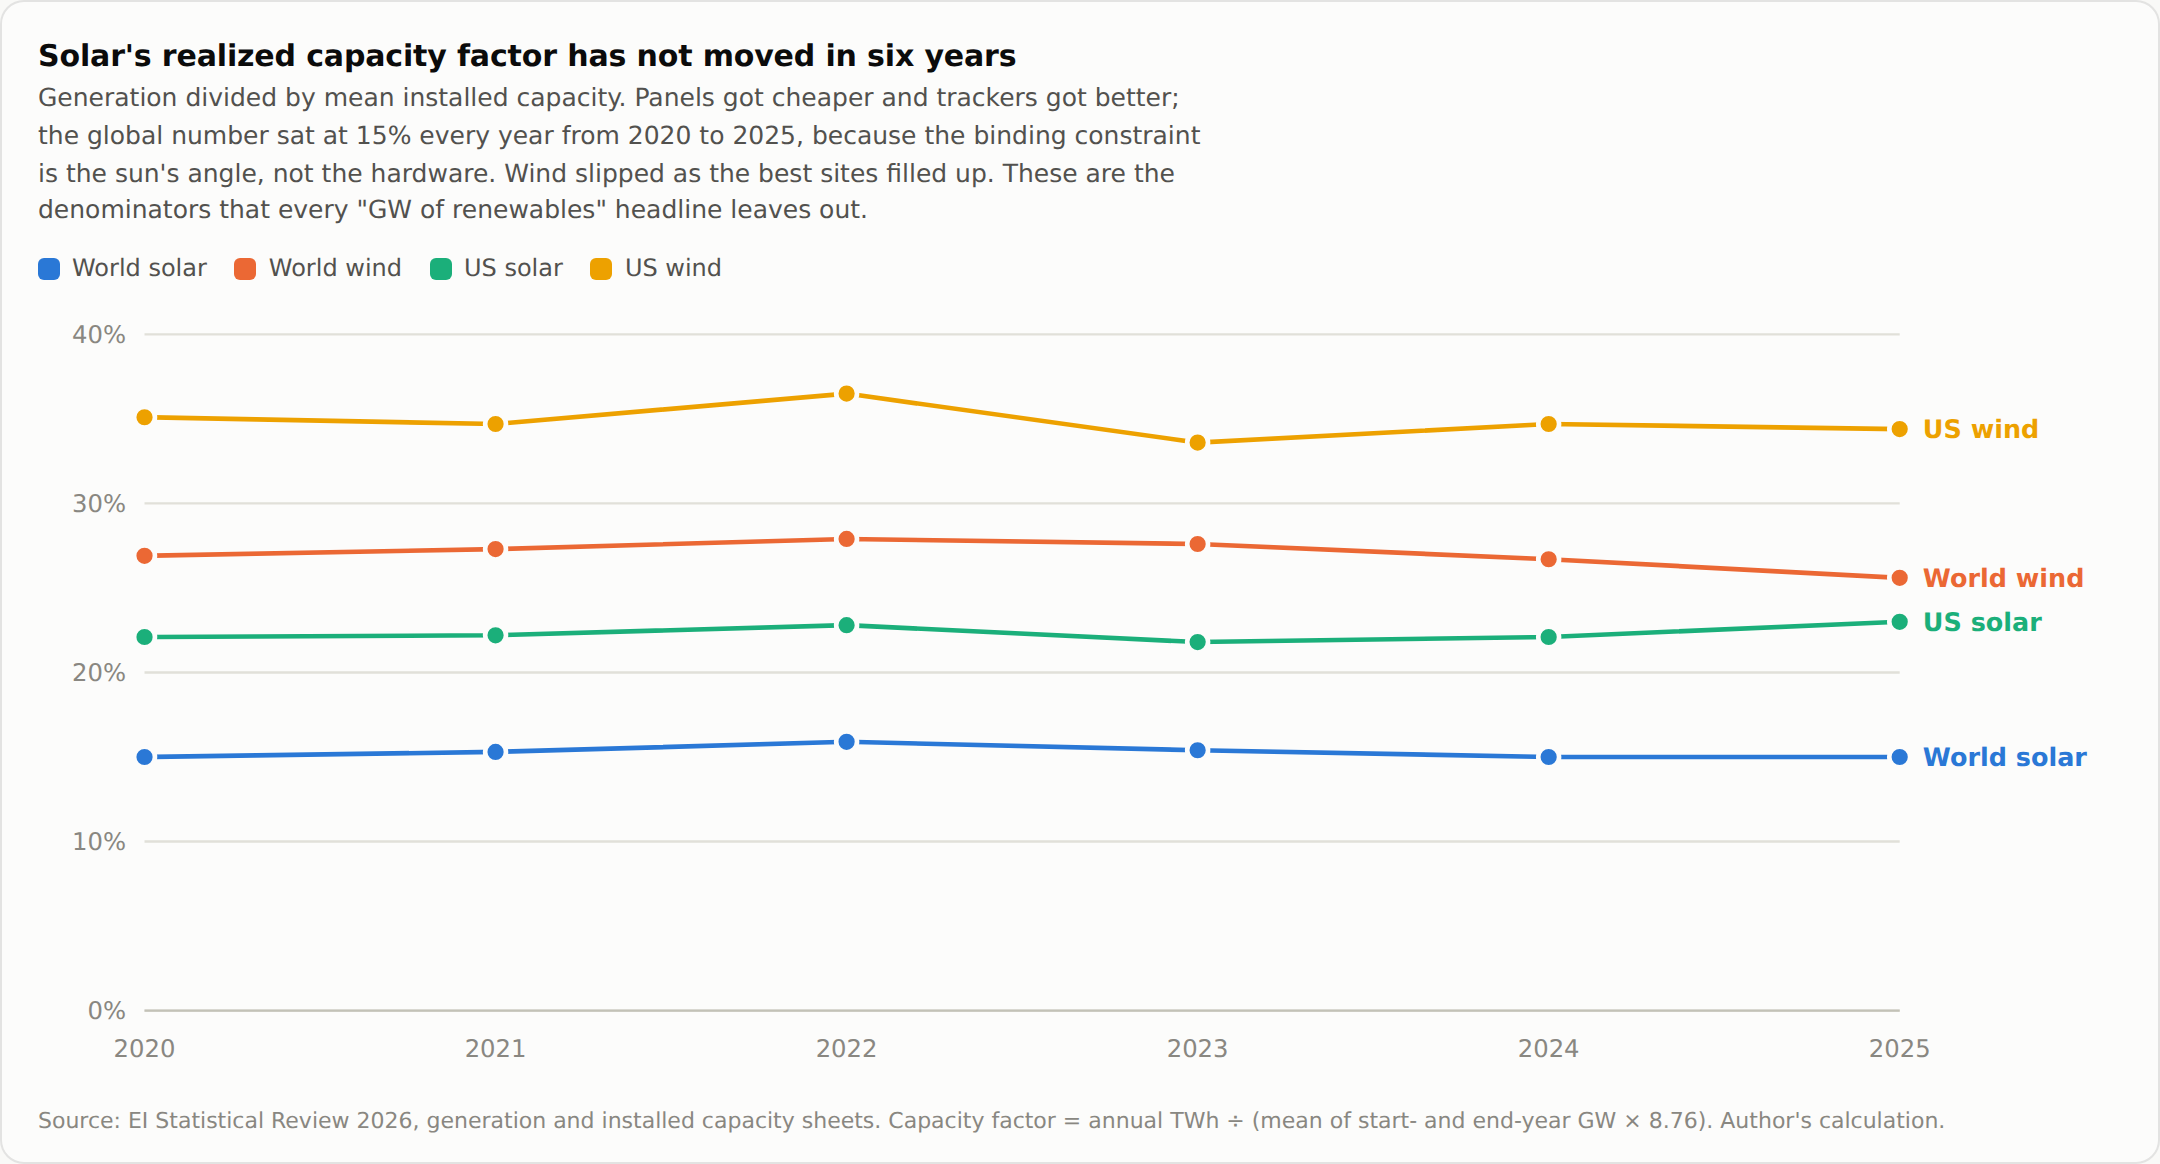
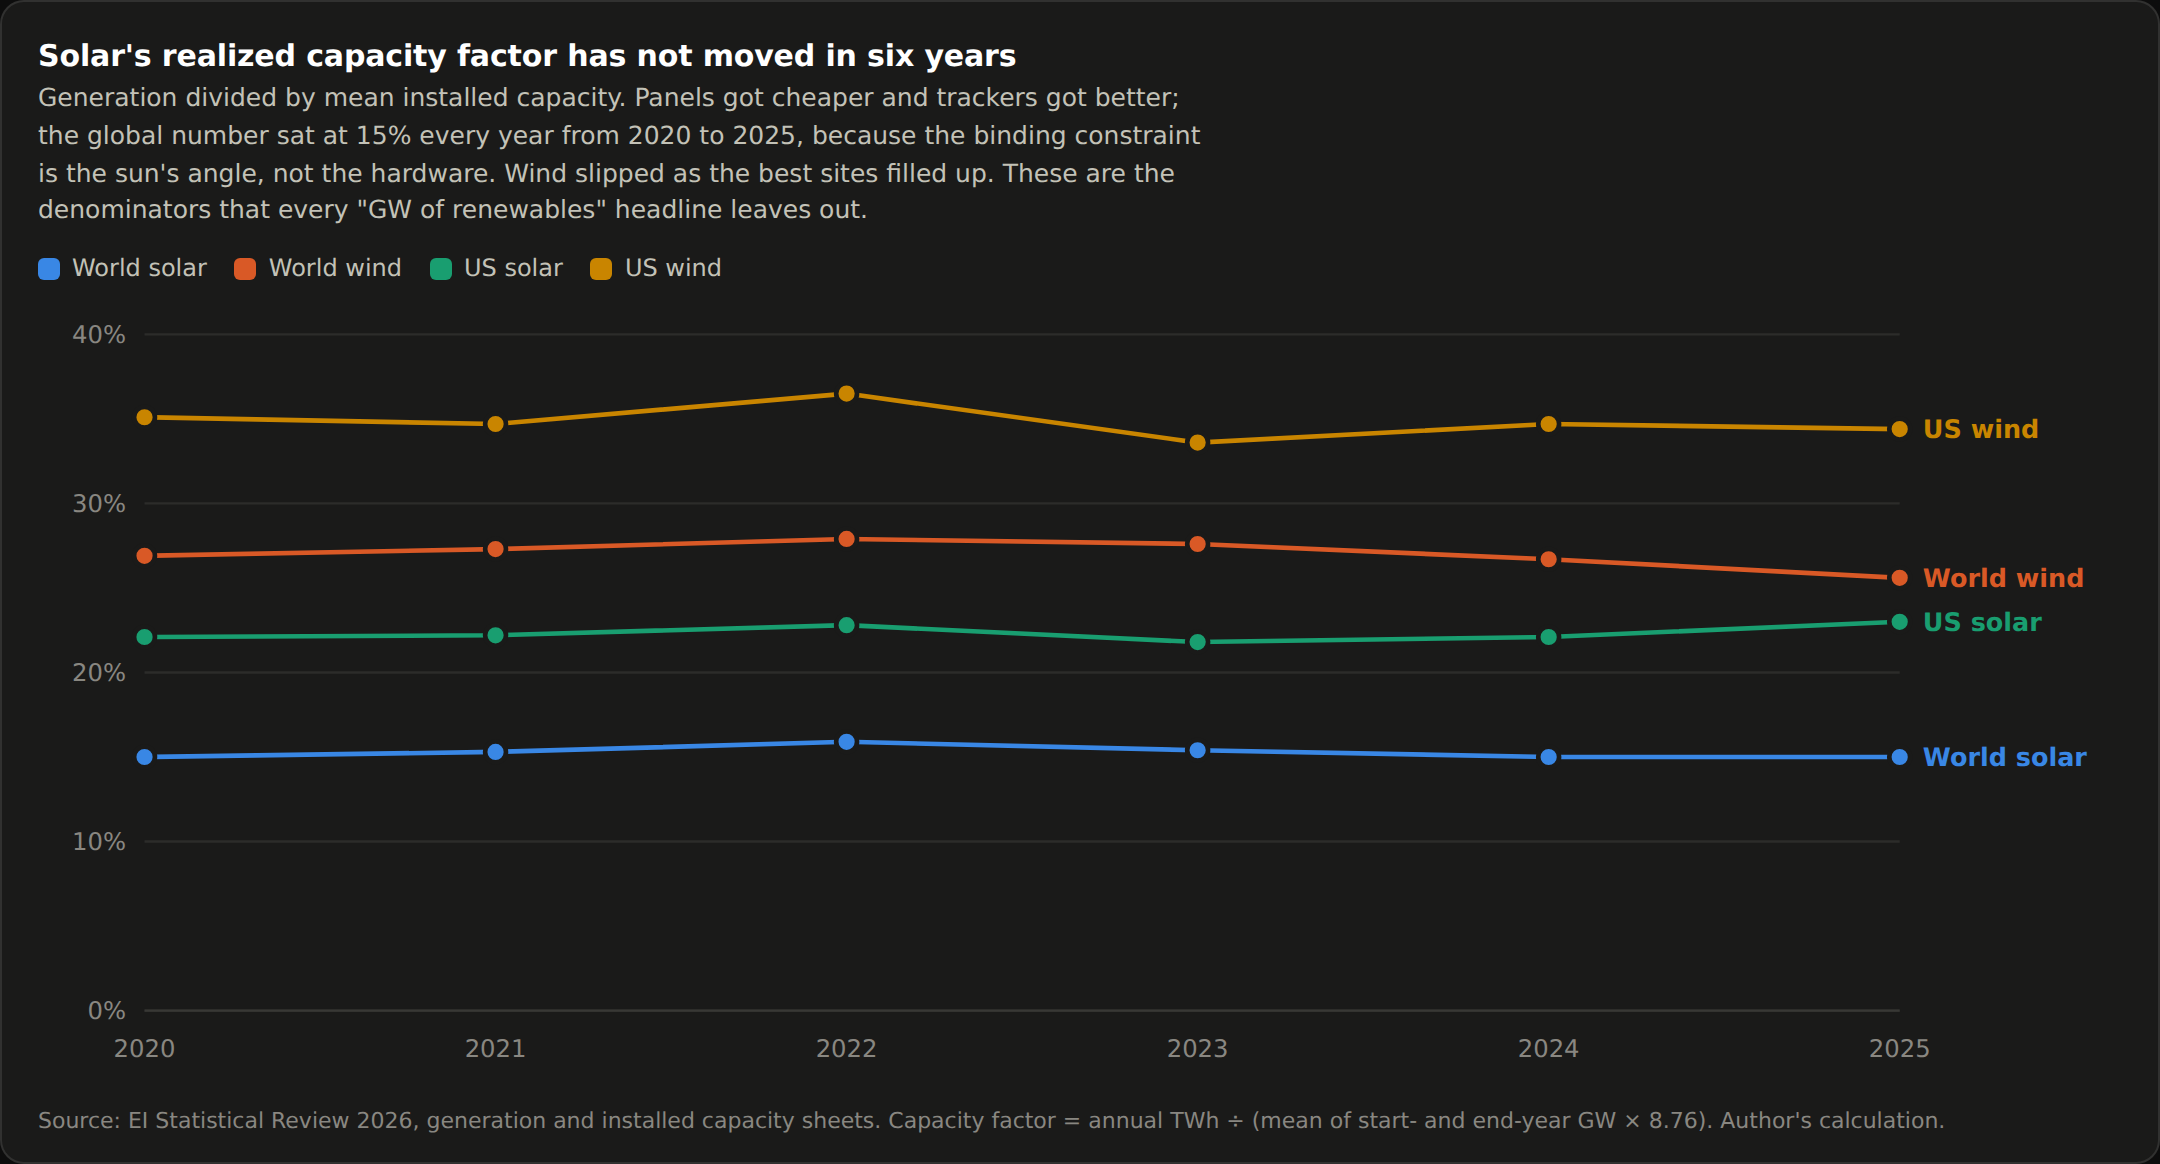
Global solar's realized capacity factor hasnt moved in ~6 years. Modules got cheaper, cells got more efficient, trackers proliferated, and the number sat at 15%, because the binding variable is the angle of the sun and the weather above the panel. Wind has drifted down as the best sites filled.
The revenue picture is worse than the physics, and this is the part the capacity factor hides. In markets with heavy solar penetration the midday price collapses toward zero exactly when solar is generating, then spikes in the evening when its not. California and Alberta both run that curve. So solar's captured price falls faster than its capacity factor does, and a project earning 15% of nameplate at half the average market price is earning rather less than the headline suggests.
Firming one gigawatt of flat load:
- US solar at 23.0%: 4.35 GW nameplate to match annual energy.
- World solar at 15.0%: 6.67 GW.
- US wind at 34.4%: 2.91 GW.
- CCGT at 87% availability: 1.15 GW.
- Nuclear at 93%: 1.08 GW.
Matching annual energy is the easy half. Shifting it is the hard half. One average day of solar shifting needs roughly 16 to 19 GWh per gigawatt of load; a three-day continental lull needs 72 GWh per gigawatt.
Global grid-scale battery capacity reached roughly 270 GW at end-2025 on Wood Mackenzie's count, with the IEA putting 2025 additions alone at 108 GW. A spectacular build by any historical standard. At a 2.5-hour average duration that is about 675 GWh of energy. Which means:
Every grid-scale battery on Earth, dedicated to one task, carries about 9 GW of flat load through a three-day lull.
The US data center fleet already averages 36 GW.
Batteries are extraordinary at intraday shifting and at the sub-second ramps AI training imposes, which makes them a reliability component rather than a firming solution. Multi-day firmness from storage is not a 2030 technology at this scale, and any model that assumes otherwise has smuggled in three orders of magnitude.
Which is the wrong question to have been asking. The sharpest reframe I have read on this comes from a16z's profile of Base Power, and it is worth stealing: a battery and a transmission line do the same job. Both move power from where it is worth less to where it is worth more. The line does it through space. The battery does it through time. Read that way, storage is not a competitor to generation at all. It is a substitute for wire, and it should be priced against the thing in Section IV that is failing hardest.
That changes where the 675 GWh matters. Nine gigawatts through a three-day lull is a rounding error against the world's data center fleet. The same 675 GWh moved against a congested distribution feeder, in the hours that actually bind, is doing work that no interregional line will do this decade because no interregional line is being built.
Where renewables genuinely work commercially here is the queue bypass. Google and AES in Texas pair an 850 MW data center with 600 MW of solar and 945 MW of wind, never entering the ERCOT large-load queue. That is a hybrid with firm backup, accounted on annual rather than hourly matching, and worth pricing carefully: most "100% renewable" claims in this sector are built from unbundled certificates.
Hydro and geothermal
World hydro generated 4,479 TWh in 2025, the largest low-carbon source by a wide margin, and growth has stalled because the good sites are taken. It is also the source most exposed to the variable that is changing, with material drought shortfalls in recent years across Yunnan, Sichuan, Brazil, Kariba, and Norway. Firm, until the reservoir is low.
Enhanced geothermal is the most interesting small position on the board. Fervo's Cape Station is financed, drilling, and heading toward gigawatt scale with a real cost curve behind it. Through 2030 it is a rounding error against 90 GW of global average data center load. Past 2035, if the drilling economics hold, it is the only clean firm source siteable near load with no fuel cycle and no queue. That is an optionality trade, and it should be priced as one.
IV. The constraint stack
This section is the physical calendar: what binds and when. Then Section V is the portfolio: how you express it. Keeping the two apart matters, because several things that bind hard are not investable, and one or two things that are investable barely bind.
First the mechanism that connects them, because scarcity doesn't automatically become a return and the route matters more than most write-ups admit. US power markets clear on merit order. The system operator stacks generators cheapest first, and the last unit needed to meet demand sets the price for everyone. So the rent from scarcity does not accrue to the generator that sets the price. It accrues to everything sitting below that unit in the stack. If gas is setting the price in PJM, the nuclear plant, the paid-off coal unit, and the wind farm all capture the spread between their own marginal cost and the gas unit's. Neel Somani's Power 2026 is the clearest recent walk through this plumbing, and worth reading alongside this piece for the depth I have just compressed into a paragraph.
Two things bound that rent. Energy-only markets cap it by administrative fiat, ERCOT at $5,000/MWh and Alberta at C$1,000. And the same scarcity that lifts the inframarginal spread invites the new entry that eventually closes it, which is why almost every position in Section V has a clock on it.
1. High-bandwidth memory, now through end-2027. DDR5 spot prices have gone from roughly $4.70 to $46 since late 2024, a tenfold move across memory broadly, and HBM sits at the tight end of it. The physical reason is that HBM3E consumes about three times the wafer capacity of DDR5 per gigabyte, so every gigabyte of AI memory crowds out three of everything else, and a new fab takes two years.
Now size it against the forecast. Enverus traces AI chip production from about 1.2 GW of server capability in 2023 to roughly 25 GW a year by 2030. The IEA's Base Case adds about 20 GW a year of accelerated servers over the same period. The central demand forecast is running just under the chip industry's own projected output ceiling for the whole decade, with no slack in between. That is the definition of a forecast set equal to a constraint, and it means any memory or lithography surprise translates close to one-for-one into forecast revision in either direction. It is already moving capex: Amazon raised 2026 guidance from $200bn to $220bn and named the higher cost of memory as the reason.
2. Gas turbines, now through 2029. GE Vernova's book went from 83 GW at end-2025 to 100 GW in Q1 2026 to 116 GW in Q2, guiding to 125 GW at year end. Siemens Energy holds 69 GW. Mitsubishi holds 35 GW of large-frame, up 52% year over year. Call it 220 GW across the big three against 52 to 60 GW a year of output: 3.7 to 4.7 years of coverage. Prices are on track to reach about $600/kW by end-2027, roughly triple the 2019 level.
Turbines in 2026 feel like tanker rates in 2004: an unglamorous, capital-intensive, oligopolistic bottleneck nobody wanted to own until the whole trade routed through it.
Then read the disclosure underneath. GE Vernova's 116 GW is not 116 GW of orders. It's 53 GW of firm equipment backlog plus 63 GW of slot reservation agreements, so 46% firm, down from 58% in April 2025. The company shipped 3 GW in the second quarter. Siemens and Mitsubishi don't disclose a comparable split, but if their mix resembles GE Vernova's, the true firm global backlog is nearer 100 GW than 220 GW and the turbine constraint is roughly half as severe as the headline implies. The 53/63 breakdown appears in trade press; the Q2 release quotes only the combined figure. Anyone sizing this trade off the headline is sizing it off a reservation book.
Three further things a careful underwriter needs.
Data centers are only about 20% of GE Vernova's backlog and roughly 28% of Siemens' commitments. The rest is coal replacement, general load growth, grid firming. This is a broad electrification trade wearing an AI label, which is a feature rather than a bug: it does not collapse if AI capex disappoints.
The vendors themselves say they are not the constraint. Scott Strazik puts directional lead times on new heavy-duty orders at about three years, with roughly 10 GW remaining across 2029 and 2030, and says plainly that "the gas turbines are really not the gating item, when you're talking about a three-year cycle from when a project starts, the EPC build out, the permitting, the fuel availability." His incentive runs the other way, of course. A man with a 116 GW book and 10 to 20% price premiums has every reason to claim capacity is adequate. Take it as an interested party's testimony; the 30 GW/yr by 2030 target is still a checkable commitment with a date attached.
And the binding sub-layer is narrower than the headline suggests. It is not assembly floor space. It is single-crystal hot-section blade casting, a far smaller supply chain than the announced expansions imply.
What has genuinely repriced is the project, not the machine. All-in CCGT cost runs $1,116 to $1,427/kW for near-term commercial operation against $2,000+/kW for 2030 and 2031 delivery, and NextEra's CEO says the cost to build a gas plant has tripled. At $2,000/kW all-in, dedicated gas is no longer obviously cheaper than solar plus storage plus overbuild on a capital basis; the case rests entirely on capacity factor and firmness. Any levelized cost assumption in a 2024 or 2025 data center model is stale by 50 to 100%.
3. Transformers and electrical balance of plant, now through 2029. Large power transformer lead times now run three to four years, with substation transformers quoted past 160 weeks against 24 to 30 months before 2020. Waits for the generation step-up transformers that connect a plant to the grid have tripled. Upstream, the chokepoint is grain-oriented electrical steel and the skilled labor to wind coils, neither of which responds to a purchase order. China holds roughly 99% of refined gallium, about 60% of ferrite cores, and near 99% of LFP cell manufacturing, which puts a trade-policy variable inside an engineering constraint.
4. Interconnection, now through 2032. From Lawrence Berkeley's Queued Up: 2026 Edition, covering requests through end-2025:
- About 1,312 GW of generation and 749 GW of storage sit in active US queues across roughly 8,200 projects.
- Of capacity that entered queues between 2000 and 2020, 13% reached commercial operation by end-2025. 75% was withdrawn. 10% is still waiting.
- Median request-to-operation for projects built in 2025 exceeded five years.
A data center shell takes 12 to 18 months. Its power takes five to ten years to connect, and three quarters of everything that ever joined the queue was eventually withdrawn.
ERCOT shows the noise and the signal at once. Large-load interconnection requests reached about 474 GW by August 2026, roughly 90% of it data centers, against an all-time system peak of 91.1 GW set on 22 July. That is more than five times the entire Texas grid. Nobody believes it, Governor Abbott has ordered an audit, and ERCOT has paused its Batch Zero study.
ERCOT does not believe it either, and the useful thing is that it has published exactly how much it discounts. Its adjusted load forecast applies two separate haircuts drawn from its own observed experience: officer-letter projects with 2024 in-service dates delivered 55.4% of their load on schedule, and data centers that came online between 2022 and 2024 drew 49.8% of the megawatts they requested at peak. Multiply them and a 100 MW data center request enters the plan as 27.6 MW.
Those two numbers are worth separating, because they are the two failures in this piece measured independently by a system operator. The 49.8% is the unit problem: the press-release gigawatt is roughly half a gigawatt of actual draw. The 55.4% is the conversion problem: nearly half of what was attested to by an officer of the utility did not show up on time. Neither is a forecast. Both are ERCOT counting what happened.
Transmission is the piece that fails quietly. The US built roughly 322 miles of 345 kV and above in 2024, against a five-year average near 345 miles a year. DOE's National Transmission Planning Study puts the need on the order of 5,000 miles a year. That is a shortfall of about fourteen times, and it is getting worse, not better: the 2013 peak was near 4,000 miles.
Two details make it worse than the ratio suggests. US transmission capex is rising from roughly $25bn to $30bn a year, but more than 90% of that is lower-voltage reliability and replacement work rather than new interregional capacity. "Record transmission investment" headlines are describing pole replacement. And in the fourteen years since FERC Order 1000, zero interregional transmission projects have been completed, against NERC's assessment that 35 GW of additional interregional transfer capability is needed by 2033.
There is no mechanism in place today that moves stranded Midwest wind or Gulf gas to Virginia load. None is being built. The cleanest illustration is upstate New York, which has surplus nuclear generation and no way to get a meaningful share of it to Manhattan.
5. Copper, from about 2030. The IEA's 2026 Critical Minerals dataset: 2025 demand of 27,775 kt against 23,227 kt of mine production, with announced-project mine supply peaking near 24,571 kt in 2030 and then declining to 17,183 kt by 2040 against Stated Policies demand of 34,984 kt. Electricity networks alone take 4,544 kt today, rising to 6,449 kt by 2035, with grade decline doing most of the damage.
Fuel appears nowhere on this list.
V. The opportunity map
Generation equipment and electrical balance of plant
The Section IV facts make the position: order books into the 2030s, prices tripling, five-year revenue visibility in businesses the market has always valued on cyclicality. Turbine OEMs, transformer manufacturers, HV cable and switchgear, and the grain-oriented electrical steel upstream of all of it.
Three things break it, in order of how much they should worry you. The backlog is 46% reservations, and reservation books convert at rates nobody discloses. The suppliers themselves say permitting is the gate. And every capacity expansion is announced with a public date.
Scarcity rent here is a countdown, not an annuity, and the clock is on the vendors' own slides.
Which is why the cleaner expression may sit one layer down, in blade casting and the electrical balance of plant, where nobody has announced a comparable expansion.
Already-interconnected assets
With a 13% queue completion rate and a five-year median, the energized interconnection agreement is the asset. The generation attached to it is an implementation detail.
That covers existing nuclear, converted crypto sites (TeraWulf, Hut 8, CleanSpark, Cipher), retiring coal plants with live interconnection, and merchant independent power producers sitting in load-growth zones.
We now have a price for it. TeraWulf discloses roughly $19bn of contracted revenue from Anthropic over a 20-year lease covering approximately 401 MW of critical IT load at Hawesville, Kentucky, ramping to full capacity by early 2028. Divide it out and the implied rate is about $270/MWh at full utilization, and nearer $340 at the 80% load factor Duke plans new large loads against.
Set that against what the underlying energy costs. Gas sets the marginal price in most hours in most US markets, and Henry Hub averaged $3.52/MMBtu in 2025. At a fleet combined-cycle heat rate that is roughly $25/MWh of fuel. Wholesale energy in gas-set hours clears in the tens of dollars. The lease clears in the hundreds.
One honest caveat, because it cuts against the cleanest version of this: TeraWulf does not disclose whether energy sits inside that lease rate or is billed through separately. If it is a pass-through, the $270 is the facility rate on top of the power, and the premium over the physical inputs is larger still rather than smaller. Either way the shape holds. Most of what the tenant is paying for is not electrons. It is a building, a cooling system, and an interconnection agreement that already exists.
That is the conversion layer with a number on it, in a signed contract, and it is better evidence for this thesis than anything I could build from the top down.
Homer City is the same trade in physical form. A 2 GW coal plant that closed in July 2023 and was demolished in March 2025, now being rebuilt as a 4.5 GW gas campus on 3,200 acres, with existing substations and existing transmission into both PJM and NYISO, sitting on top of the Marcellus. Capital cost above $10bn for the power infrastructure and site readiness alone, before any data center is built. That is roughly $2,220/kW, which independently lands at the top of the repricing band in Section IV and was arrived at by people actually writing the cheques. It carries brownfield remediation and the demolition of a 2 GW coal plant that a greenfield site would not, so read it as the top of the band rather than the middle.
It also takes seven GE Vernova 7HA.02 units, against a big-three output of 52 to 60 GW a year. One campus is roughly 8% of a year's worldwide heavy-duty turbine capacity.
The premium is priced entirely off scarcity, so interconnection reform that actually works would deflate it, and so would demand disappointing against the 30 to 55% conversion band.
Behind-the-meter and speed-to-power
xAI built 140 MW in 122 days at Memphis and now runs Colossus off a self-built 1.2 GW gas plant. Janus Henderson puts behind-the-meter at more than 10 GW of 2027 US delivery, close to half the total.
That is revealed preference, and it is unambiguous. Developers are paying a real premium in cost, emissions, and political exposure specifically to avoid the queue. Whoever can compress time-to-power captures that premium.
The risk is social license, and it is already binding. Nitrogen dioxide concentrations rose in Memphis neighborhoods near Colossus after the turbines went in, and roughly 20 US projects representing about $98bn were blocked or delayed by local opposition in a single quarter of 2025. Of everything on this list, this is the trade most likely to be stopped by people rather than physics.
There is a second version of this trade that uses interconnections nobody had to build. Base Power puts oversized batteries on houses and dispatches them as a fleet, and the reason it works is the same reason a converted crypto site works: the connection already exists, so there is no queue. The scale is no longer theoretical. Base runs more than 500 MWh in Texas, deploys around 40 MW a month, and on a16z's arithmetic that annualized run-rate is close to 2% of everything the United States added in lithium-ion storage last year. The number I find more persuasive is the mix: utility partnerships went from under 5% of sales volume a year ago to more than half, with Austin Energy contracting 40 MW and CoServ 100 MW after weighing it against utility-scale developers. Regulated utilities picking distributed capacity over the conventional option is revealed preference from the most conservative buyer in the sector.
Two honest caveats. The a16z piece is a portfolio write-up, so read the growth framing as an interested party's. And the arbitrage this business runs on narrows as the fleet that captures it grows, which is the same countdown attached to every position in this section.
The LNG chain and the Henry Hub spread
$2.60 against $21 is not a mispricing waiting to close. It is a physical constraint on liquefaction and pipe, and the liquefaction build is a larger claim on American gas than every data center in the country. The spread advantages US-sited compute, US gas-fired generation, midstream takeaway in Appalachia and the Permian, and the export chain.
Faster liquefaction narrows it. A Hormuz reopening compresses the JKM and TTF risk premium quickly. Weigh both against the fact that the spread survived four months of outright closure and two more of contested transit through the world's most important chokepoint, which tells you roughly how structural it is.
Nuclear fuel cycle
Conversion and enrichment are tighter than mining, less crowded than the miners, and structurally short whether or not a single SMR ever gets built, because the existing fleet plus restarts plus uprates already exceeds contracted Western enrichment capacity. Restarts and uprates are the only nuclear megawatts arriving before 2030, which makes their operators the near-term expression of the same view.
Russian supply normalizing would break it. So would Western enrichment expansion landing faster than the decade these things usually take. Both are policy-dependent rather than technical, which is a different risk than most people price.
Materials
Copper, on the IEA's own supply curve: announced mine supply declining to 17.2 Mt by 2040 against roughly 35 Mt of demand, with electricity networks the largest single energy-technology draw, rising from 4,544 kt in 2025 to 6,449 kt by 2035.
The market is already there. LME copper set an all-time high of $14,527.50/t on 29 January, COMEX printed a fresh record in the second week of August, and the LME three-month contract closed at $14,160/t on 14 August with cash trading nearer $14,500 on a backwardation squeeze. Against the Energy Institute's 2025 average of $9,950/t that is about 42% higher.
And here is where I have to argue against myself, because the same price-elasticity point I made about proved gas reserves applies with equal force to announced mine supply. "Announced projects only" is a floor, not a forecast. Copper at $15,000 produces mines that appear in nobody's current pipeline. The price has already done half the work, which is precisely when a structural-deficit thesis is most dangerous to enter.
Hold this one more loosely than the arithmetic makes it feel.
Flexibility and efficiency
The most capital-light position in the stack and the least crowded, on one number from Duke's Nicholas Institute. Their Rethinking Load Growth study covers 22 balancing authorities and about 95% of US peak demand, and finds that if new loads can be curtailed for just 0.25% of their uptime, the existing grid absorbs 76 GW of them. Raise the curtailment allowance to 0.5% and it is 98 GW; to 1.0% and it is 126 GW.
Look at what that 0.25% actually costs. Eighty-five hours a year, averaging 1.7 hours per event, and in 88% of those hours more than half the load stays on. The headroom sits where the demand is: PJM 18 GW, MISO 15 GW, ERCOT 10 GW, SPP 10 GW, Southern 8 GW at the half-percent level. Seventy-six gigawatts is roughly 10% of national peak demand, and it is available for free, today, on wires that already exist.
Flexibility is nearly free and almost nobody uses it, because uptime contracts were written before power was scarce. Demand-response aggregators, grid-interactive uninterruptible power supplies, and the software layer that makes training interruptible are where the value gets captured.
The neatest expression of it inverts who has to be flexible. In a zonally traded capacity market, cutting demand at a house is functionally the same as adding supply at a data center in the same zone, which means a hyperscaler can buy its way past a capacity constraint by paying for batteries on somebody else's roof. Base is building exactly that under the "bring your own capacity" heading. It also solves the problem in the paragraphs above this one: a campus that arrives carrying lower bills and backup power for the neighborhood is a campus with a social license, which is the constraint most likely to stop the behind-the-meter trade.
There is a deeper reason this stays unpriced. The production cost models that system operators and utilities use to plan the grid treat demand as inelastic, fixed regardless of price, because that assumption is what lets the problem be solved as a straightforward cost minimization. The planning apparatus is structurally unable to see the cheapest available answer.
Contract inertia breaks it. Contract inertia is also the entire reason the opportunity exists.
VI. Where a gigawatt can land
Ranked by realistic time from decision to energized power, which is the only ranking that prices:
| Route | Lead time | Ceiling |
|---|---|---|
| Behind-the-meter gas, self-built | 6–18 months | Air permits, turbine slots |
| Converted crypto site, interconnected | 6–18 months | Finite inventory |
| Nuclear restart or uprate | 18–36 months | A handful of units, then exhausted |
| Co-located renewables with firm backup | 2–3 years | Land, and how you count it |
| New CCGT, grid-connected | 3–5 years | Turbine queue into 2029+ |
| Utility generation through the queue | 5–10 years | 13% completion rate |
| New multi-state HV transmission | 7–11 years | Siting |
China connects gigawatts fastest, and Section I covered why: the headroom. The transmission gap is the other half of it, and needs stating carefully, because the popular version is wrong. China builds roughly 1,490 miles a year of high-voltage line against the US's 345, and spends about $115bn a year on grid capex against $25bn to $30bn: 4.3 times on volume, 4.2 times on capital. The commonly quoted "ten times" comes from measuring against America's single worst year. The real difference is categorical rather than proportional. China operates 45 ultra-high-voltage projects at 800 to 1,100 kV, one of them a 3,293 km line at ±1,100 kV rated 12,000 MW, and typically moves from approval to energization in about two years. The United States operates no UHVDC at all and carries a 61-month median just for interconnection.
Everywhere else is a smaller version of the same question. The Gulf pairs cheap gas with fast permitting, and the IEA models it at 0.7 GW by 2030 against 8 to 10 GW announced. That is one of the larger unexplained gaps in the published forecasts and it deserves original work. Ireland has paused new Dublin-area connections to 2028 at 21% of national electricity. Northern Virginia is heading to 39 to 57% of state electricity by 2030 on EPRI's numbers, which is a political constraint dressed as an engineering one.
VII. The case against all of this
Energy is cheap next to hardware, and the gap is bigger than most people assume. Epoch AI's cost model puts a 1 GW AI data center at $38bn of up-front capital and $8.5bn a year of all-in ownership cost, of which energy is $0.6bn. That is 7%. Servers are 60%. An operator who can fund the silicon can fund almost any power price, and if that holds, power is a pass-through and the scarcity rent accrues to compute rather than to electrons.
The response is that 7% of a very large number is still a large number, and that a pass-through only works if the power exists to be passed through. But this is the strongest argument against everything in Section V and it deserves to be stated at full strength.
The demand may not be there. Grid Strategies aggregates the FERC Form 714 filings and finds utilities projecting 90 GW of data center load growth by 2030 inside 166 GW of total peak growth, against benchmark estimates that put realistic data center growth nearer 65 GW. It calls that a 40% overstatement, and separately flags the 95 to 100% load factors in some filings as about double observed reality. London Economics International, for the Southern Environmental Law Center, ran the same question through the chip supply chain and got a harder answer. Tally the data center load forecasts published by the grid operators covering 77% of US electric load and you get 57 GW of US demand growth from 2025 to 2030. Now grow global AI chip manufacturing at 10.7% a year, well above the 6.1% it managed over the past decade, and the entire world's incremental output supports 63 GW. The US would need more than 90% of every new chip made, against a country that currently buys slightly under half of them.
Read the units carefully, though, because they cut the other way and I would rather say so than let the section flatter itself. Both of those are growth figures, not 2030 levels. My base case adds 302 TWh between 2025 and 2030, which is about 34 GW of average draw. Grid Strategies' sceptical benchmark is nearly twice that, and London Economics' 57 GW is not far off it either. So the honest reading is that the two most-cited bear cases in this sector are arguments against utility forecasts, not against mine, and my central number already sits below the number the sceptics land on. That is an uncomfortable place to be. It means the demand risk in this piece is asymmetric to the upside, and the real bear case is the next two paragraphs rather than this one.
Efficiency is improving faster than almost anything in energy history. Energy per AI task is falling roughly an order of magnitude a year. Compute for a given capability halves about every eight months. Google reported a 33x reduction in energy per Gemini prompt over twelve months. Fleet PUE is heading from 1.38 to 1.21. And the largest single lever is not chips at all: it is enterprise server rooms at PUE 1.89 migrating into hyperscale facilities at PUE 1.09, which accounts for most of the gap between the IEA's High Efficiency and Base cases.
Then the question none of it answers. The IEA calculates that replacing every internet search on Earth with a simple AI text query would consume under 4 TWh a year, less than 1% of current data center consumption. So the build-out is not provisioned for search. It is provisioned for training, video, and agentic pipelines, where a single reasoning-plus-agentic task runs about 50 Wh against 0.05 Wh for a medium language model query, a factor of a thousand. No company that has disclosed per-query energy has published a breakdown of how anticipated capacity gets allocated across workloads. The IEA names the gap and does not fill it.
That is the honest floor under every number in this piece: the fuel is measurable to three significant figures, and the workload is not.
The financing question sits underneath all of it. Hyperscaler and neocloud capex is guided near $715bn for 2026, around $830bn including Chinese CSPs, larger than global oil and gas production investment. AI-2040 models hyperscaler capex overtaking operating cash flow around this quarter, with debt-financed capex reaching roughly $900bn by 2028. Demand through 2027 is largely locked because the capital is committed and the turbines are ordered. From 2028 it is a financing question, not an engineering one.
VIII. What I'm watching
A few areas that have my attention:
- The reservation-conversion ratio, quarterly. GE Vernova converted 10 GW of slot reservations into firm orders in Q2 2026, about 16% of the reservation pool. Sustained conversion below roughly 60% a year means the turbine backlog is a softer asset than the headline. This is the only item on the list you can check in ninety days rather than a year, so it goes first.
- My central case is wrong on the high side if US data center demand prints below 420 TWh in 2028, or if data centers' share of incremental US generation falls under 30% for two consecutive years. Wrong on the low side above 500 TWh or 60%. Those two thresholds bracket the 510 to 740 band on a 2028 run-rate.
- The buffer is gone if the SPR sits below 250 million barrels into 2027 without a refill under way. At that level the United States has no meaningful capacity to blunt a second disruption, and the fuel-is-not-the-constraint view has to be re-underwritten rather than repeated.
- Fuel becomes the binding constraint if Henry Hub sustains above $6 while turbine lead times shorten. Watch the ratio of the two, never either alone.
- The queue stops mattering if behind-the-meter and co-located generation exceed half of delivered US capacity by 2028. Interconnection becomes a legacy problem and the constraint moves entirely to turbines and air permits.
- The equipment trade decays as the GE Vernova, Siemens, and Mitsubishi expansions land. All three are announced and the dates are public.
- The reserves signal is geology rather than accounting if the EIA's year-end 2025 report, due April 2027, shows US dry gas proved reserves still falling at higher prices.
- Efficiency wins outright if data center electricity growth decelerates below total electricity growth for two straight years while deployed compute keeps rising.
IX. Threads I keep pulling
This piece is a map, not a survey. Honestly, there are at least five things in here that are load-bearing and under-researched, and each could be a full post rather than just a paragraph. Naming them is partly housekeeping and partly a commitment:
The load factor. Everything above turns on one number that nobody varies and almost nobody measures publicly. Dominion has disclosed 82% for large Virginia sites and Duke plans new load at 80%, against the IEA's 48% held flat for twelve years. A systematic read of utility filings, the ones that actually report observed large-load behaviour rather than planning assumptions, would settle the biggest open question in the sector. I intend to do that read.
What the build-out is for. The IEA's own arithmetic says that replacing every internet search on Earth with an AI query would consume under 4 TWh a year. The build-out is provisioned for something two orders of magnitude larger, and no company that has published per-query energy has broken out how anticipated capacity gets allocated across training, inference, video, and agentic workloads. This is the largest unexplained gap in the sector and the piece I most want to write.
The Gulf. The IEA models 0.7 GW of Middle East data center capacity by 2030 against 8 to 10 GW announced. That is not a forecast disagreement, it is a factor of twelve, and one side is badly wrong. Cheap gas, fast permits, sovereign capital, and a location problem for latency-sensitive workloads.
The nuclear fuel cycle. Enrichment and conversion get one paragraph here and deserve their own treatment: the separative work balance, the Russian share and how the import ban actually phases, what high-assay fuel really costs to stand up, and whether the announced small reactor fleet is contractible at all.
China's conversion layer. Two years from approval to energization, 45 ultra-high-voltage projects, 1,490 miles of high-voltage line a year. The interesting question is not that China builds faster. It is which specific institutional arrangements produce that, and which of them are transferable to a country that will not nationalize its grid.
Coda
The strait closed, the tankers rerouted, physical barrels printed the highest price ever recorded, and Brent finished the summer near $88 against roughly $69 in January. A 27% move, after the largest supply disruption in the history of the oil market. This episode did not disprove energy scarcity, it just temporarily relocated it.
There is enough coal in the United States to run the world's data centers for five centuries, and enough gas in the Middle East to run them for another five. None of it helps if the transformer is four years out and three quarters of everything that enters the interconnection queue never comes back out.
Everything between the resource and the electron is the conversion layer. That's where the constraint sits now, and where the rent is accruing. Not something buried in the ground: a factory order book, a permit queue, and a coil of grain-oriented electrical steel.
A note on the numbers
The capacity factors, the incremental-generation shares, the regional fuel balances, the gas-per-gigawatt arithmetic, the storage sizing, and the 2030 base case are my own calculations from primary data, not figures lifted from analyst reports. I have the math in a companion data appendix, so anyone who wants to disagree can disagree with the arithmetic rather than with me. Just ask for it and I'll share. Where I've used someone else's number it's named and dated below.
References
Primary data
- Energy Institute, Statistical Review of World Energy 2026 (June 2026): reserves, production, consumption, generation, installed capacity, grid-scale storage, data center demand. energyinst.org/statistical-review
- IEA, Key Questions on Energy and AI, including Annex A capacity and consumption tables (16 April 2026). iea.org
- IEA, Energy and AI (April 2025) and data annex. iea.org
- IEA, World Energy Outlook 2025, Annex A free dataset.
- IEA, Critical Minerals Dataset 2026: copper, lithium, nickel, and rare earth supply and demand balances.
- Our World in Data / Ember (2026), China added a Germany-sized electricity grid last year: 497 TWh added, of which 340 TWh solar and 140 TWh wind. ourworldindata.org
- EIA, US Crude Oil and Natural Gas Proved Reserves, Year-End 2024 (7 April 2026). eia.gov
- EIA, Annual Energy Outlook 2026 (April 2026); Today in Energy on retirement deferrals and coal retirements.
- EIA, air conditioning share of US electricity consumption. eia.gov
- Lawrence Berkeley National Laboratory, Queued Up: 2026 Edition, interconnection queue characteristics as of end-2025. emp.lbl.gov
- DOE, National Transmission Planning Study (2024).
- bp, Energy Outlook 2025, summary tables and chart data pack.
Analysis and market
- Our World in Data (Hannah Ritchie), How much energy do data centers and AI use? (July 2026), the IEA and EI reconciliation. ourworldindata.org
- Janus Henderson, data center capacity ledger (March 2026): 157.4 GW announced, 84.7 GW deliverable to 2030, with the year-by-year delivery schedule used in the base case.
- EPRI, Powering Intelligence 2026 (February 2026): 380–790 TWh US data center demand by 2030.
- BloombergNEF, US Data Center Capacity Outlook (July 2026): 118 GW and 12% of US electricity by 2030.
- NERC, Long-Term Reliability Assessment (January 2026).
- Grid Strategies, National Load Growth Report (December 2025).
- London Economics International for the Southern Environmental Law Center, Uncertainty and upward bias are inherent in data center electricity demand projections (7 July 2025): 57 GW of implied US demand growth against 63 GW of incremental global chip supply, covering grid operators representing 77% of US load. SELC summary.
- East Daley Analytics, Get in Line (August 2026), and data center gas demand forecast.
- Wood Mackenzie and Power Engineering, gas turbine market (April 2026): prices projected to reach ~$600/kW by end-2027.
- Epoch AI, What you need to know about AI energy use (July 2026), and Total cost of ownership of a one-gigawatt AI data center (May 2026): $38bn capex, $8.5bn/yr TCO, energy $0.6bn, utilization 71%, PUE 1.14.
- Nicholas Institute, Duke University (Norris et al.), Rethinking Load Growth: Assessing the Potential of Large Flexible Loads in US Power Systems: 76 GW of curtailment-enabled headroom at a 0.25% curtailment rate across 22 balancing authorities.
- Neel Somani, Power 2026: Electricity Pricing in the Age of AI (2026), on merit-order dispatch, locational marginal pricing, and the mechanics of trading power.
- Homer City Energy Campus: 2 GW retired coal to 4.5 GW gas, 3,200 acres, >$10bn power infrastructure, air permit approved November 2025.
- Anthropic and TeraWulf, $19bn 20-year lease, up to 401 MW critical IT, Hawesville, Kentucky (July 2026).
- Utility Dive and Turbomachinery Magazine, GE Vernova backlog at 116 GW and the 53 GW firm / 63 GW reservation split (23 July 2026); Siemens Energy Q3 FY26 (10 August 2026).
- pv magazine and ESS News, US transformer lead times extend to four years (May 2026).
- Erin Price-Wright, Base Power & the Future of Electricity, a16z (4 August 2026): distributed storage as a substitute for transmission; Base fleet and utility-partnership figures. Disclosure: a16z is an investor in Base Power.
- SemiAnalysis; Bessemer Venture Partners; Exelon via Utility Dive, announced-versus-delivered capacity counts.
Prices and current conditions
- IEA, How global oil supplies have readjusted to help fill the huge gap left by the Strait of Hormuz shock (22 June 2026): demand down ~5 mb/d in Q2, inventories down 3.8 mb/d, North Sea Dated at an all-time $144 in April.
- IEA, collective action of 11 March 2026: 400 million barrels, the largest emergency release in IEA history. DOE, 172 million barrels from the SPR.
- CNBC, SPR below 300 million barrels, lowest since 1983 (10 Aug 2026) and cavern integrity risks (15 Aug 2026).
- EIA, Short-Term Energy Outlook, global oil markets: Brent fell to $69 on 2 July after the June US-Iran memorandum and reached $105 on 23 July; shut-ins peaked at 11.2 mb/d in May. CNBC, tanker attacks and the 23 July close at $100.69.
- Canada LNG Group, weekly gas price update (10 August 2026): JKM low $21s, TTF $18.8, Henry Hub $2.6. EIA, Short-Term Energy Outlook (August 2026): Henry Hub $3.44 for 2026, $3.31 for 2027.
- LME copper all-time high, $14,527.50/t, 29 January 2026; LME three-month close 14 August 2026.
- bp, Bumerangue discovery, Santos Basin (4 August 2025).
Prior work in this series
- The Coming Collision Between AI's Appetite and America's Energy Reality, Second Breakfast, December 2025.
- The Era of "Or" Arrived Four Years Early, Second Breakfast, March 2026.
Nothing here is investment advice. Do your own diligence.
├─ READ NEXT
Four months after modeling three scenarios for US gas scarcity, all three are obsolete. The Strait of Hormuz is closed, 19% of global LNG supply is offline, and the era of "and" ended on February 28, 2026. Here's the revised thesis.
The United States is building two generational infrastructure booms simultaneously, and they're about to collide. AI datacenters and LNG exports are betting on the same finite resource: American natural gas.
The agent-payment protocols are free, and the open ones carry almost no money. The return sits with whoever issues the agent's credential and writes the rule for who eats a bad payment, mostly card networks and issuers, and with whoever owns the shopper's attention.
├─ DISCUSSION
Comments are powered by GitHub Issues. Join the conversation by opening an issue.
⊹Add Comment via GitHub